 By Ryan Fetterman December 14, 2022
With cyberattacks growing in scale and complexity, it has never been more difficult to figure out where to invest your time and defensive resources. This remains the core challenge of optimizing an effective security organization.
 A good prioritization approach should be data-driven, and informed by real attacker activity. ATT&CK helps address both these points, functioning as a standard lexicon for threat reporting and allowing the security community to compare independent perspectives of adversary activity using shared terminology and understanding.
Many organizations produce yearly threat reporting using ATT&CK to tag the Tactics, Techniques, and Procedures (TTPs) they are seeing in the wild. Examples include the yearly Mandiant M-trends Report, the Red Canary Threat Detection Report, and the CTID ATT&CK Sightings Ecosystem. These reports rank ATT&CK techniques by the frequency (%) that they are seen in the incidents analyzed by these organizations, producing macro-level representations of what adversaries are observed doing over time.
In addition to these macro-level reports, CISA produces granular, public-sector threat reporting in the form of CISA alerts, which tag adversary TTPs observed using ATT&CK. These alerts are more specific to individual incidents or campaigns, but if we aggregate them across the year they are published, we can match the format of the rest of our yearly reports by calculating the frequency different techniques are being reported.
As a security researcher and ATT&CK-enthusiast, I wondered what we could learn from combining these perspectives. By pulling data sources together, and zooming out to analyze the whole picture, we can create a novel perspective on how attackers operate.
(Psst: we just updated these results for 2023. Check it out.)
Splunking for Answers
By aggregating this data we can answer the following questions:
- What are the consensus top ATT&CK techniques, and how strong is this consensus?
- Does public reporting differ from private?
- Has the landscape of attacker tradecraft substantially changed from 2020-2022?
- Can we correlate techniques that are related to the top techniques – eliciting typical paths of adversary actions?
Data Exploration
Let’s take a look at our data. We have assembled three years of reporting from M-Trends (2020-2022), three years of top technique reporting from Red Canary’s Threat Detection Report (2020-2022), top techniques from the CTID ATT&CK Sightings Ecosystem (2022), and three years of CISA alerts over the same timeframe. This dataset provides a strong representation of adversary activity from multiple sources spanning 2020-2022. Together these sources report at least one sighting of more than 400 out of the 594 total current ATT&CK techniques!
ATT&CK Technique Identifiers (TID) are unique tags formatted “T####” to represent each technique. With a little eval hack to strip the “T” character, we can treat this identifier as a number, and 3-D scatter plot the data over three dimensions – Year, TID, and Percentage Frequency.
| eval result = replace(TID, “^.”, “”)
| table Reporter, Year, Percentage, result
Some quick observations from this graph:
- Most techniques observed are concentrated at lower percentages, and distributed outward to 40-50% for the highest frequency techniques.
- The vertical lines in yellow are a result of techniques being cited in tables once per CISA report, creating common frequency percentages.
- No ATT&CK technique IDs exist from 1217-1480 (it’s a MITRE thing).
- Clusters of techniques in 2020, 2022 in TID 800-range are ATT&CK for ICS Techniques.
Finding Consensus?
Do these sources agree on the top techniques they are observing in the wild? One method to force a consensus is by calculating and sorting the average frequency of each technique, for example: | stats avg(Percentage) by Year. This list looks like:
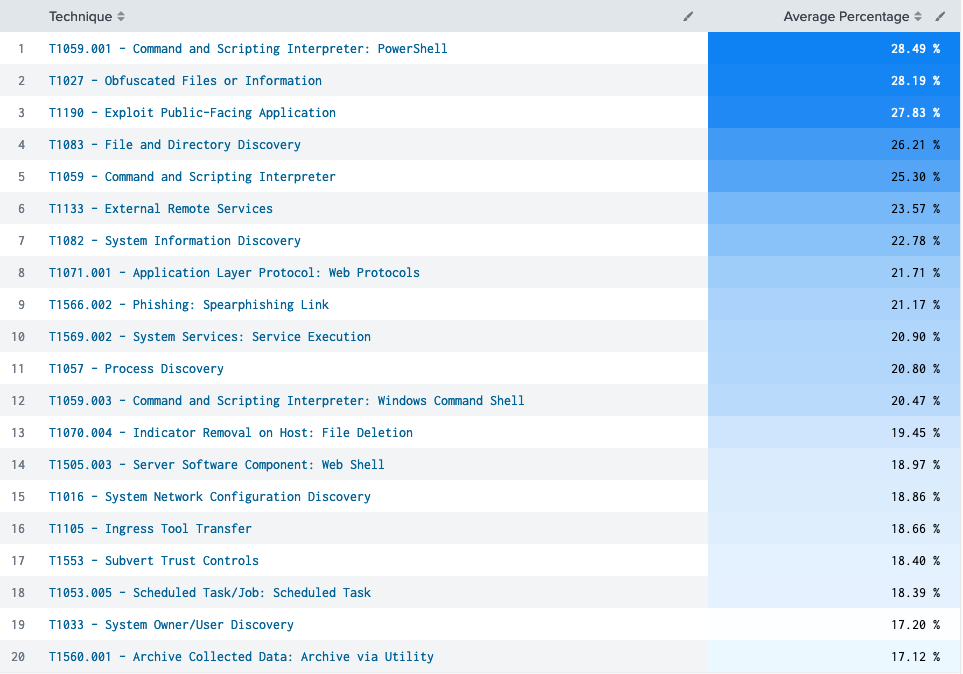
As a quick consensus Top-20, this can be a great start to prioritize what TTPs to target for detection and threat hunting. But how representative is this picture across the various sources of reporting? With a closer look, we can see many of these “Top Techniques” by average were not actually included in the Top 10 or Top 20 rankings of all sources:
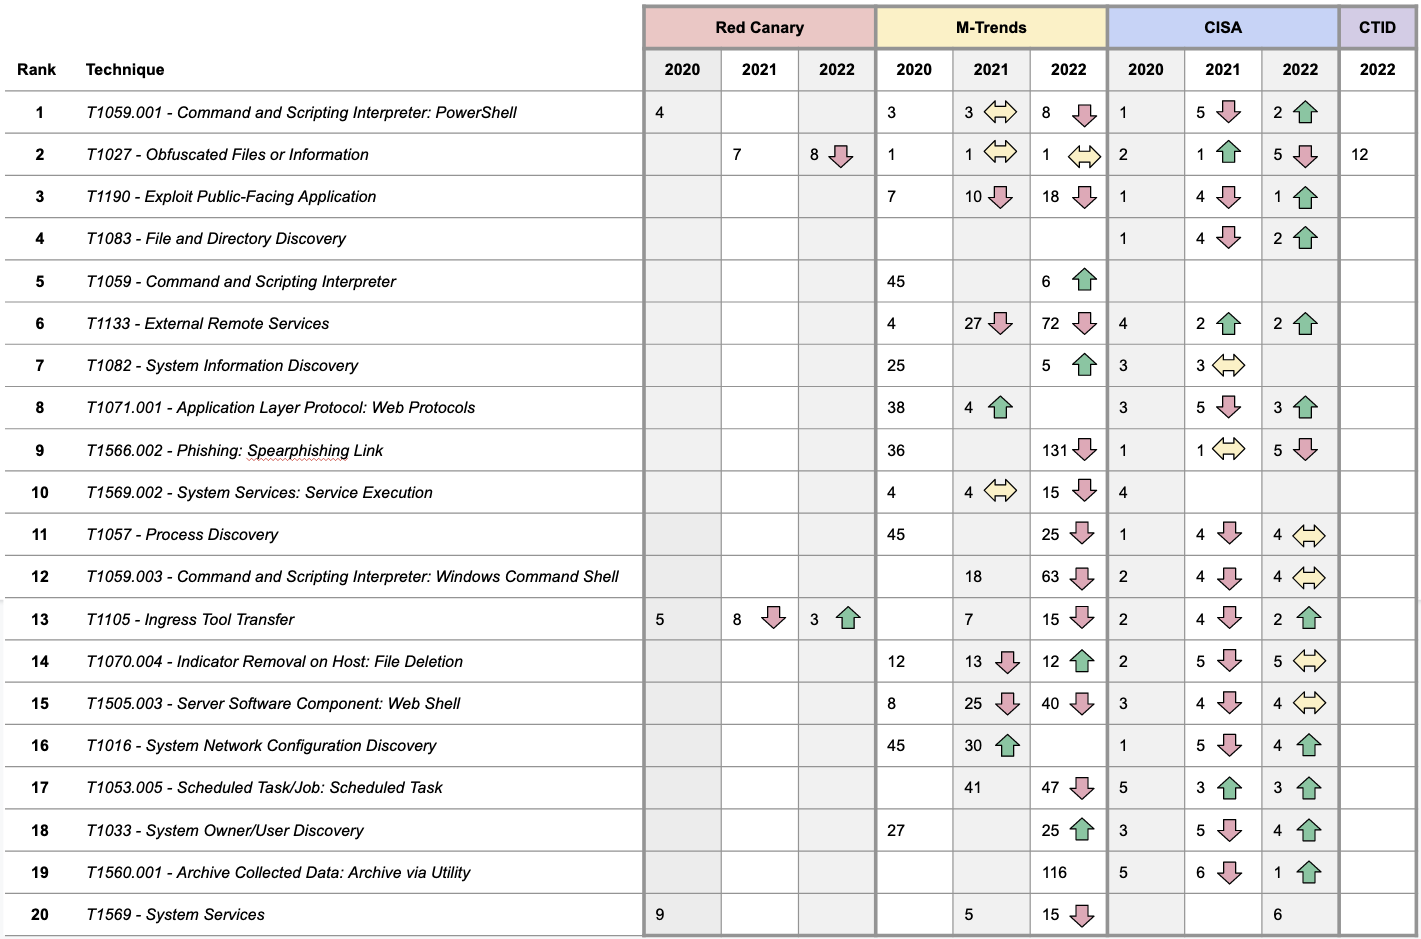
This is partly because the data from Red Canary and CTID only contains the top 10 to 20 techniques each year. In other cases, however, there are gaps between the more granular level reporting from M-trends and CISA alerts.
We can find stronger consensus techniques that appear in the top-20 ranking of at least three of the four sources consistently over the timeframe. This provides a more concentrated list of interesting targets:
- T1059.001 - Command and Scripting Interpreter: PowerShell
- T1027 - Obfuscated Files or Information
- T1105 - Ingress Tool Transfer
- T1569 - System Services
The columns in this table suggest that these organizations are more consistent with their TTP reporting internally, but for the most part there is not strong consistency across the group. Let’s check these hypotheses about differences in groups.
Public vs. Private?
To check if there is a substantial difference in the TTP sightings between Public and Private reporters, we can chart the average frequency for each of the top techniques, and calculate the difference, e.g.:
| chart avg(Percentage) OVER “ATT&CK Technique” by Type
| eval delta = Private - Public
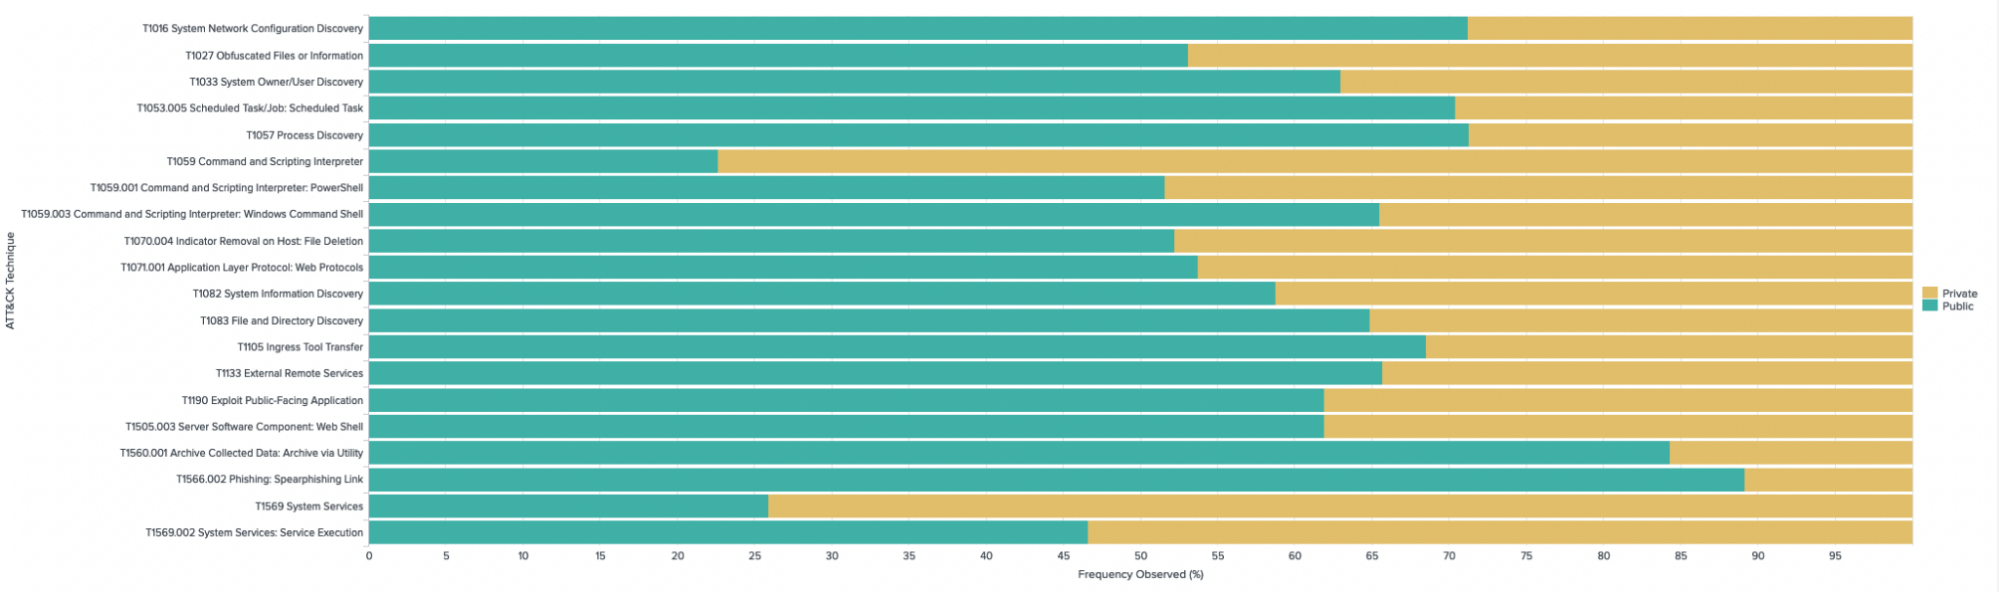
The chart shows a high consistency between what is observed, with a slight difference in the frequency of how often. However, the difference in frequency between public and private reporting is only 7.5% on average, with higher frequency of top TTPs found in public reporting.
Across the Ages (2020-2022)
While we only have three years of data, this is still enough for us to produce a rough trendline of how these organizations are observing the frequency of their top ATT&CK TTPs over time, e.g.: | chart useother=f avg(Percentage) OVER Year by Technique.
These time charts show the change in frequency of the top techniques reported by each source over three years.
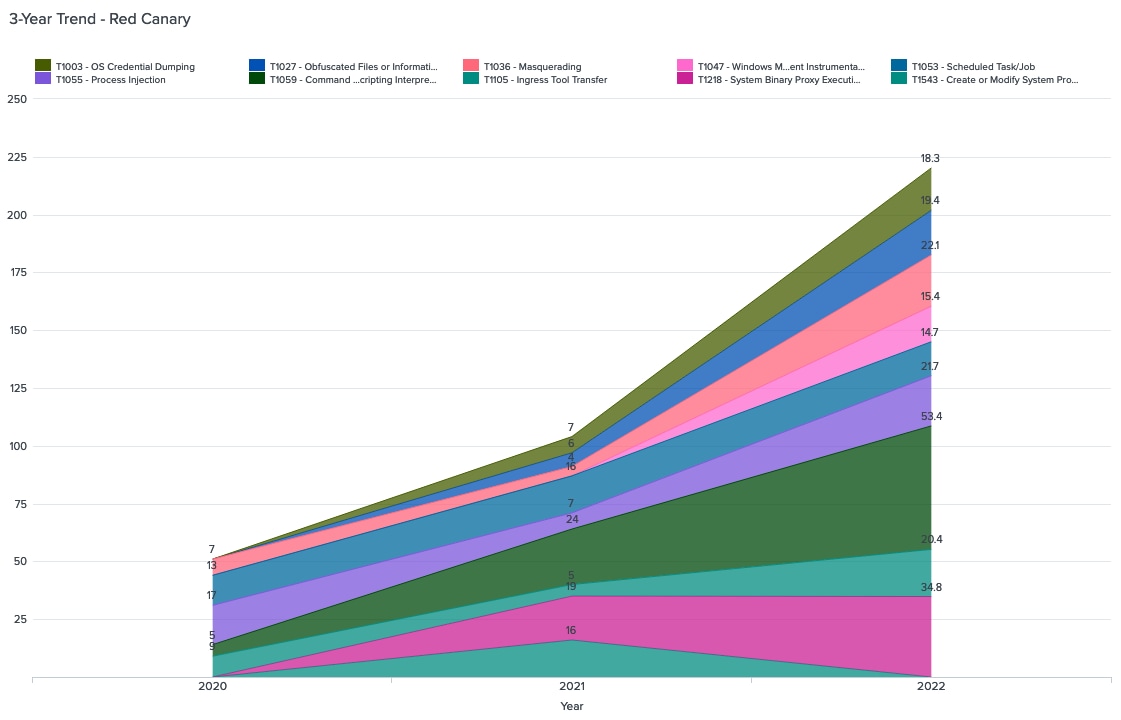
Red Canary Threat Detection Report Top Techniques (2020-2022)
Technique |
2020 |
2021 |
2022 |
|---|---|---|---|
T1003 - OS Credential Dumping |
NR |
7 |
18.3 |
T1027 - Obfuscated Files or Information |
NR |
6 |
19.4 |
T1036 - Masquerading |
7 |
4 |
22.1 |
T1047 - Windows Management Instrumentation |
NR |
NR |
15.4 |
T1053 - Scheduled Task/Job |
13 |
16 |
14.7 |
T1055 - Process Injection |
17 |
7 |
21.7 |
T1059 - Command and Scripting Interpreter |
5 |
24 |
53.4 |
T1105 - Ingress Tool Transfer |
9 |
5 |
20.4 |
T1218 - System Binary Proxy Execution |
NR |
19 |
34.8 |
T1543 - Create or Modify System Process |
NR |
16 |
NR |
Red Canary’s reporting shows consistency in their Top-10, with an increase in the frequency of most techniques across the board. Notably there is a sharp increase in the detection of T1059 - Command and Scripting Interpreter over time.
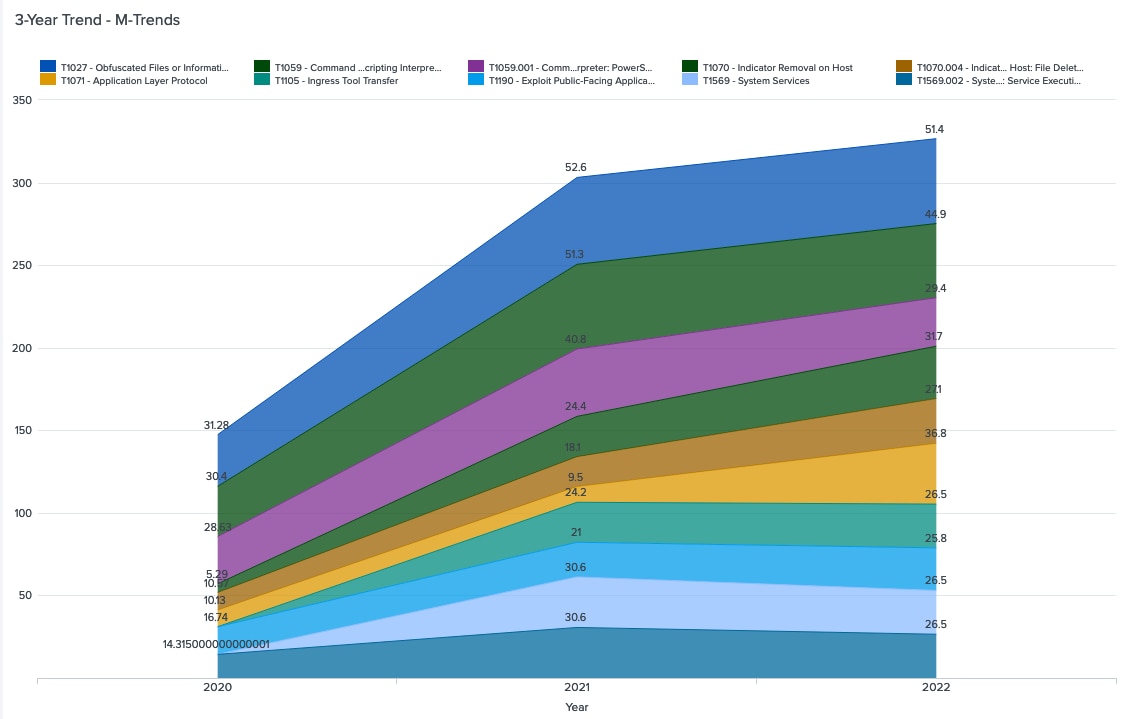
M-Trends Top Techniques (2020-2022)
Technique |
2020 |
2021 |
2022 |
T1027 - Obfuscated Files or Information |
31.28 |
52.6 |
51.4 |
T1059 - Command and Scripting Interpreter |
30.4 |
51.3 |
44.9 |
T1059.001 - Command and Scripting Interpreter: PowerShell |
28.63 |
40.8 |
29.4 |
T1070 - Indicator Removal on Host |
5.29 |
24.4 |
31.7 |
T1070.004 - Indicator Removal on Host: File Deletion |
10.57 |
18.1 |
27.1 |
T1071 - Application Layer Protocol |
10.13 |
9.5 |
36.8 |
T1105 - Ingress Tool Transfer |
NR |
24.2 |
26.5 |
T1190 - Exploit Public-Facing Application |
16.74 |
21 |
25.8 |
T1569 - System Services |
NR |
30.6 |
26.5 |
T1569.002 - System Services: Service Execution |
28.19 |
30.6 |
26.5 |
Again, the top techniques seen in M-trends are highly consistent across three years. Similar to Red Canary, the data shows an increase in Command & Scripting Interpreter detection, in this case more specifically, the use of PowerShell. We also see a steep increase in the detection of adversaries trying to cover their tracks by removing indicators from hosts.
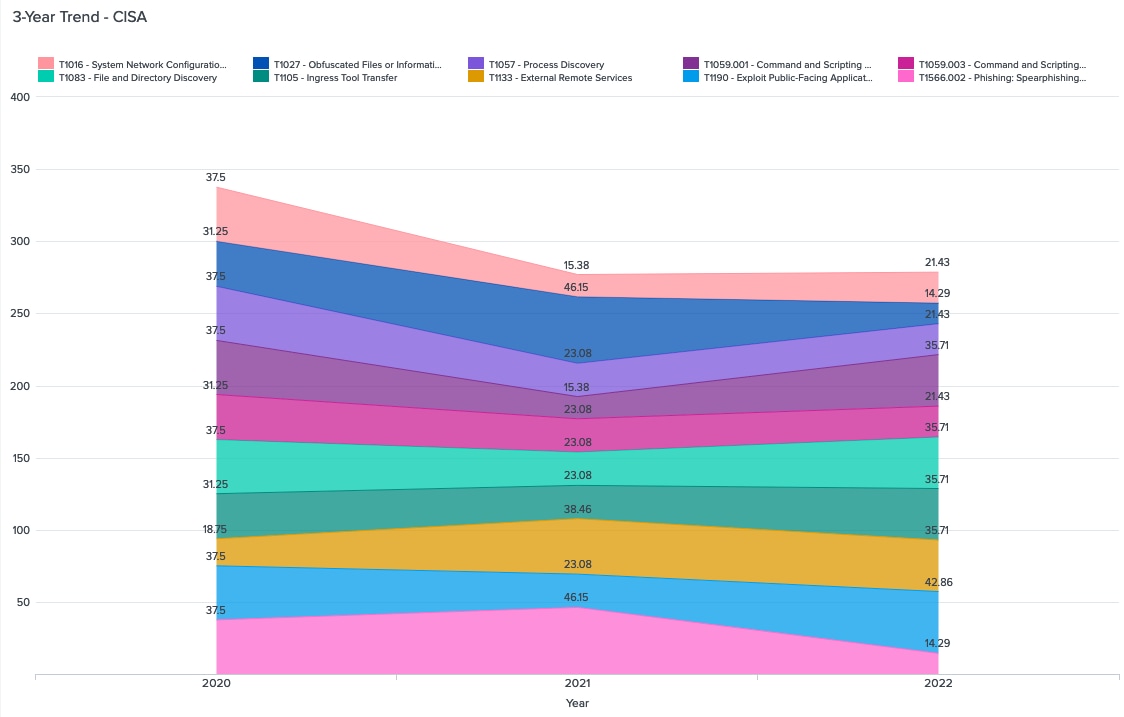
CISA Alerts Top Techniques (2020-2022)
Technique |
2020 |
2021 |
2022 |
T1016 - System Network Configuration Discovery |
37.5 |
15.38 |
21.43 |
T1027 - Obfuscated Files or Information |
31.25 |
46.15 |
14.29 |
T1057 - Process Discovery |
37.5 |
23.08 |
21.43 |
T1059.001 - Command and Scripting Interpreter: PowerShell |
37.5 |
15.38 |
35.71 |
T1059.003 - Command and Scripting Interpreter: Windows Command Shell |
31.25 |
23.08 |
21.43 |
T1083 - File and Directory Discovery |
37.5 |
23.08 |
35.71 |
T1105 - Ingress Tool Transfer |
31.25 |
23.08 |
35.71 |
T1133 - External Remote Services |
18.75 |
38.46 |
35.71 |
T1190 - Exploit Public-Facing Application |
37.5 |
23.08 |
42.86 |
T1566.002 - Phishing: Spearphishing Link |
37.5 |
46.15 |
14.29 |
CISA’s alerting data looks like it trends down slightly. This is most likely just due to a small sample size of approximately 43 reports analyzed over the three year window. Exploitation of public-facing applications, and spearphishing with links are the initial access methods for the majority of incidents each year!
Overall this data establishes the trends of the top techniques from 2020-2022 for each source. Top techniques are pretty consistent from year-to-year, with some fluctuation in technique frequency up or down. This follows our expectation about consistency, because these groups are likely using and improving their own standardized toolsets, data collection processes, and detection methods.
Connecting the Dots
Now that we’ve established the top TTPs overall and the top TTPs per source, and over time, we have confidence in the behaviors adversaries commonly use – but beyond these core techniques what will they do next?
Because we have incident-level data in the form of CISA alerts, we can correlate how often ATT&CK TIDs are seen together. Beyond the first step, correlation is not necessarily transitive – but we can link a source technique to its potential prior, or next hops, and then look for commonality here across techniques.
To achieve this, we need to generate a correlation matrix, where each technique is listed on both the X and Y axis, generating a correlation-coefficient score roughly equivalent to how often they are sighted together. Correlation matrices are often visualized as a heatmap, where darker red clusters are highly associated techniques.
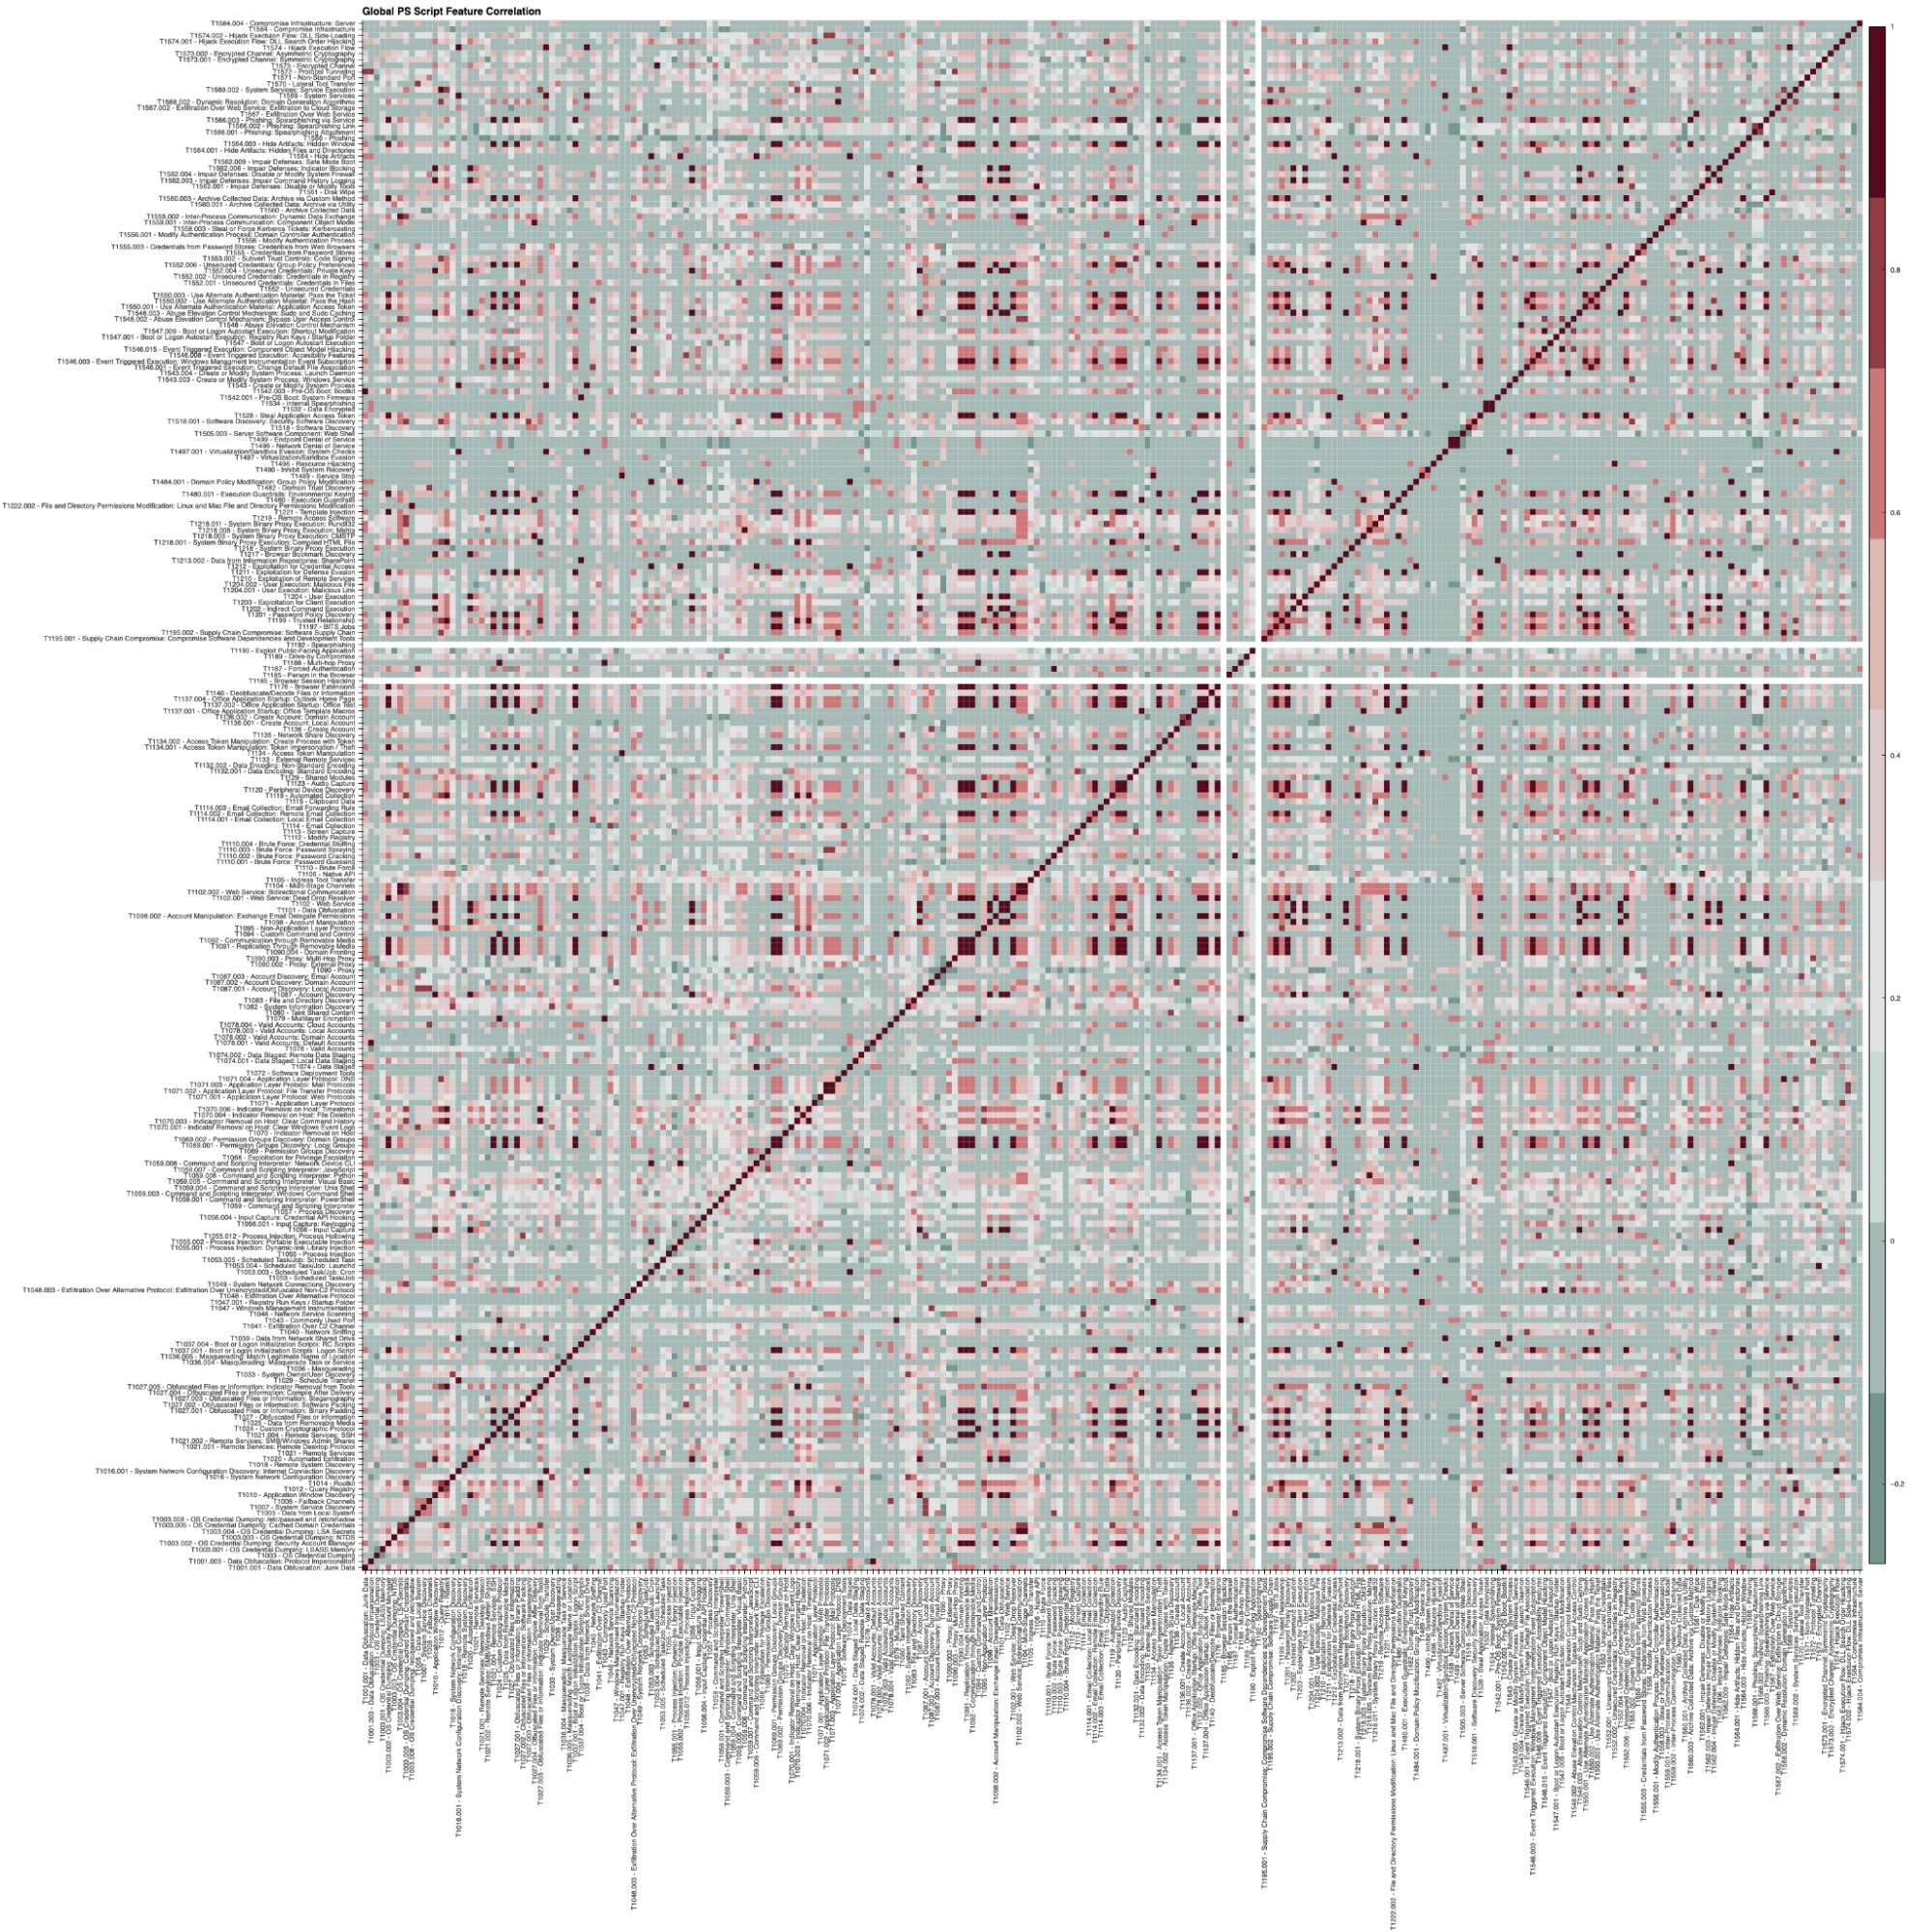
No, this graph is not supposed to be readable! But it gives an impression of the scale and the amount of concentrations of high correlation. Let’s find an example to go one step further.
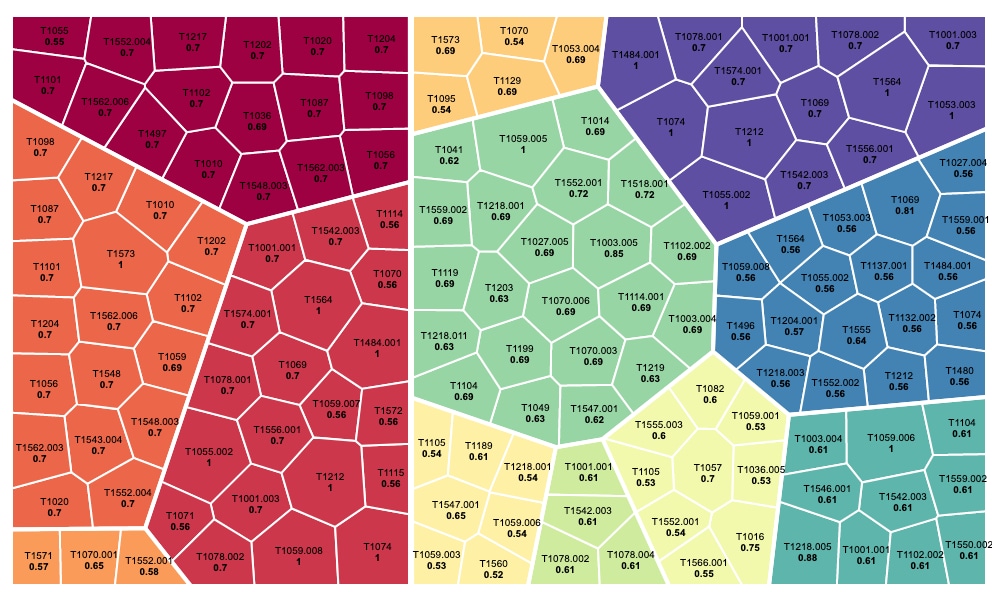
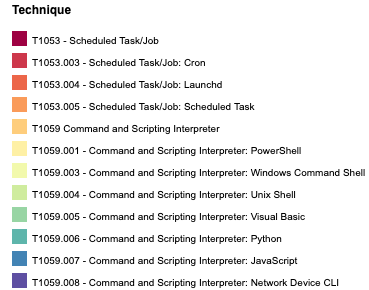
CTID found during their Sightings Ecosystem project that techniques like Scheduled Task/Job [T1053] and Command and Scripting Interpreter [T1059] serve as facilitators for many other techniques. This implies that many other techniques will be highly-correlated with these techniques in threat reporting, making these techniques a good case study for testing correlation analysis.
By plotting these two technique families with their correlated techniques, we can confirm there are a high number of behaviors that are highly correlated! In this plot, the warm-colored fragments to the left side of the vertical line represent T1053 and each sub-technique, the cool-colored fragments to the right of the central vertical line represent T1059 and each sub-technique. Each color represents 1053.X or 1059.X technique or sub-technique. Each cell within a fragment is a correlated technique, labeled with the correlated TID, and with cell size determined by the correlation strength (r-score) printed in the bold font.
Using an arc graph identifies overlaps between correlated techniques – links on the right-side connect a technique with its correlated techniques, and links on the left show correlated techniques that are shared between at least two of these T1053 or T1059 source techniques.
T1053 - Scheduled Task/Job Techniques and Correlated Techniques
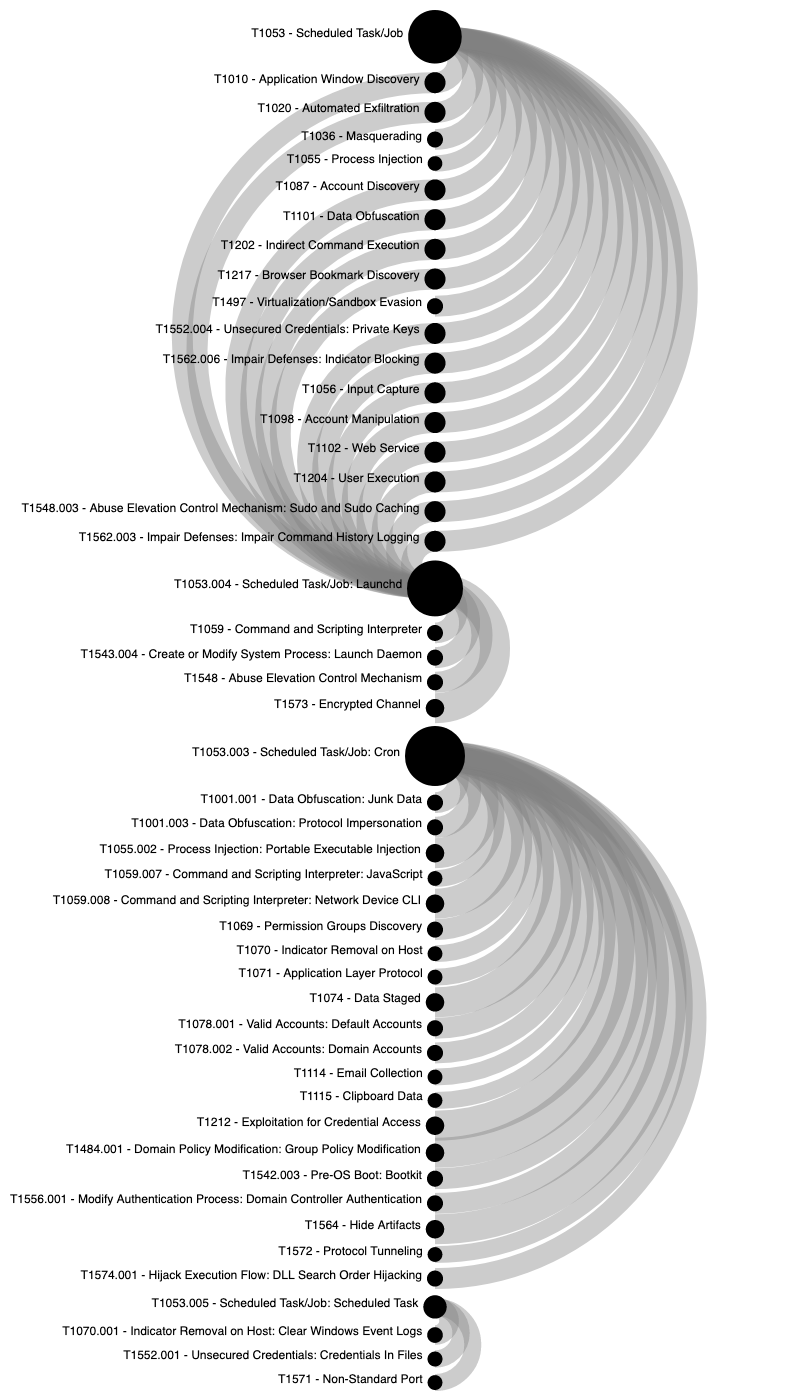
Surprisingly, there isn’t much overlap between the correlated techniques of the different T1053 - Scheduled Task components. This suggests that, depending on the specific task scheduling method used, the adversary is more likely to follow distinctly different paths to achieve their next objective.
T1059 - Command and Scripting Interpreter Techniques and Correlated Techniques
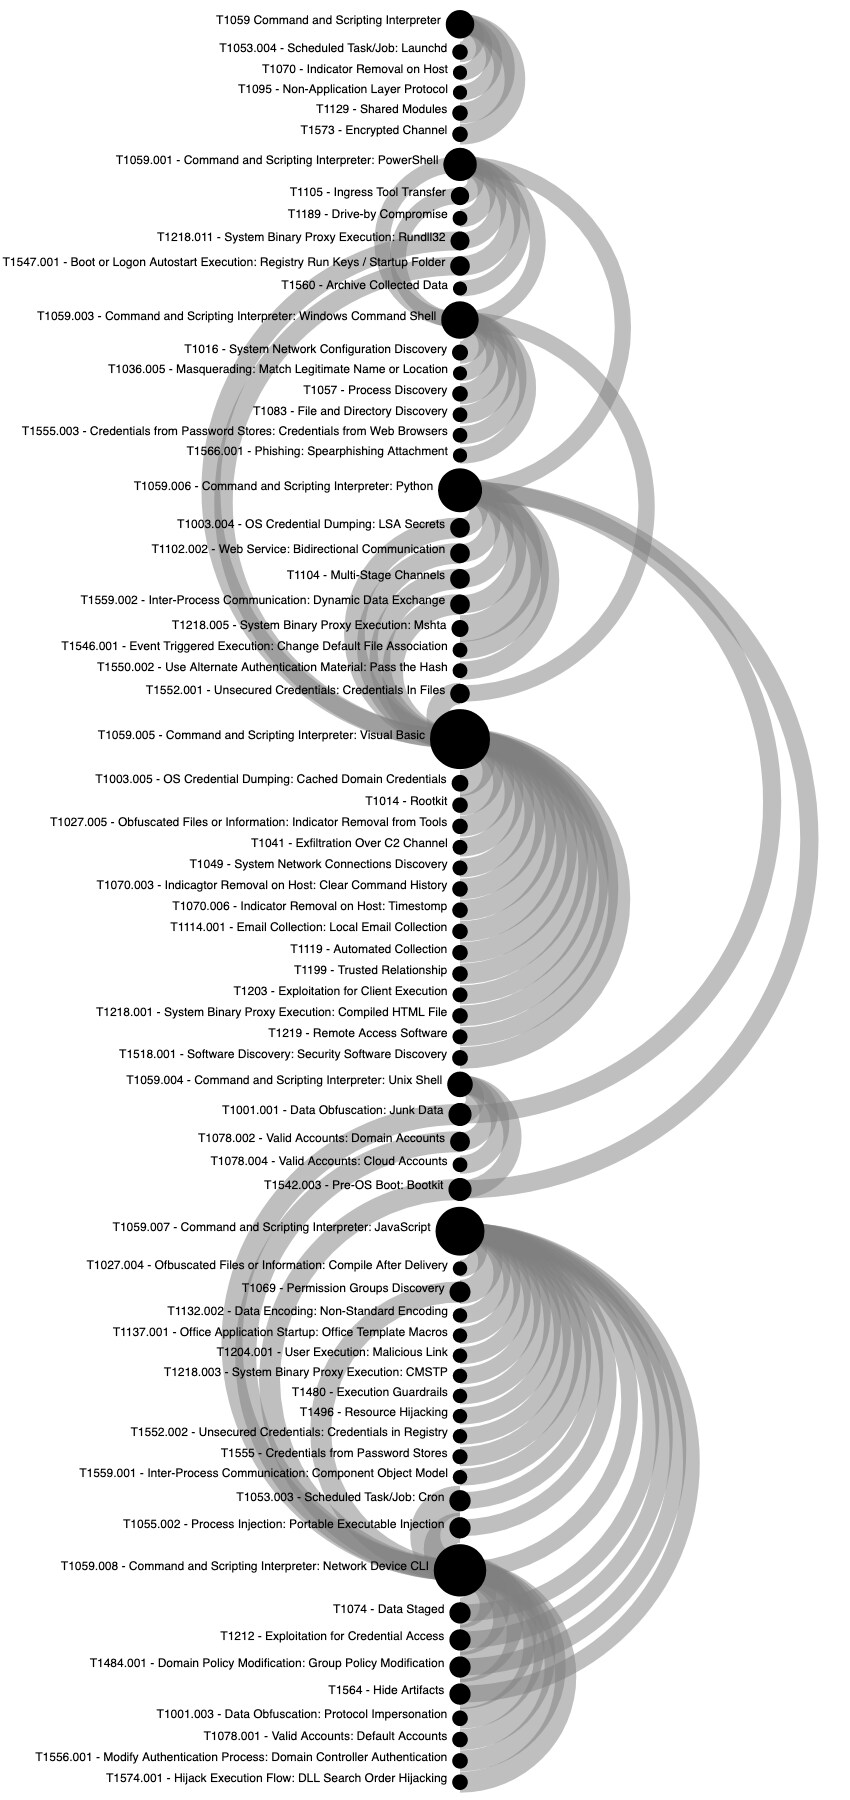
There are many left-side arcs in the [T1059] graph, identifying multiple shared, correlated behaviors. While we can expect some divergence based on the access and the underlying operating system of different Command and Scripting Interpreters, we can also see where they have similarities, revealing some of the common objectives for using these techniques, e.g.:
- T1069 - Permissions Groups Discovery
- T1547.001 - Boot or Logon Autostart Execution: Registry Run Keys / Startup Folder
- T1003.004 - OS Credential Dumping: LSA Secrets
Final Thoughts
- Combining these trusted, open, public and private data sources gives us macro-level insights into what attackers are doing to inform our defensive planning.
- Averaging frequency percentages techniques observed generates a useful list of top techniques, but it isn’t actually a strong consensus across all organizations.
- Differences in ATT&CK mapping, varying toolsets, detections, and customers can explain stronger consistency within reporting organizations vs. across reporting organizations during the time analyzed.
- Public vs. Private technique reporting is relatively consistent in terms of the techniques sighted and the percentage frequency (average 7.5% difference).
- Eliciting attack paths via correlation shows where techniques and subtechniques lead to divergent paths of related activity. This method can reveal interesting insights into relationships between observed TTPs and adversary objectives.
- As usual – adding data going forward can provide greater clarity to these insights!
One More Thing…
This work demonstrates the value of open public & private threat reporting, and community standardization around ATT&CK. And that's why we just updated this information for 2023, too.
In this spirit of collaboration we’re sharing the compiled data – so follow along, or dive in to find your own insights! You can also watch the RSAC 2023 speaking session to learn more about this research.
Happy Splunking!