 By Muhammad Raza September 19, 2023
Synthetic monitoring is one holistic technique within the wide world of IT monitoring and application performance monitoring (APM) and it’s focused on web performance. Synthetic monitoring emulates the transaction paths between a client and application server and monitors what happens.
The goal of synthetic monitoring is to understand how a real user might experience an app or website.
In this article, let’s go deep with this topic. You probably will learn a thing or two about how to get more value from your synthetic monitoring tools and strategy.
How synthetic monitoring works
Synthetic monitoring can be used to collect a range of performance information and answer questions like:
- Website performance and availability, like “Is my website up? How fast is my site loading?”
- Incident resolution, like “Have we fixed our failed shopping cart transactions?”
- Optimization opportunities, like “Is there any part of this transaction where users are getting stuck? How or where can I optimize?
Explore Splunk Synthetic Monitoring, a leading tool, or watch this Tech Talk about real-world uses of this solution.
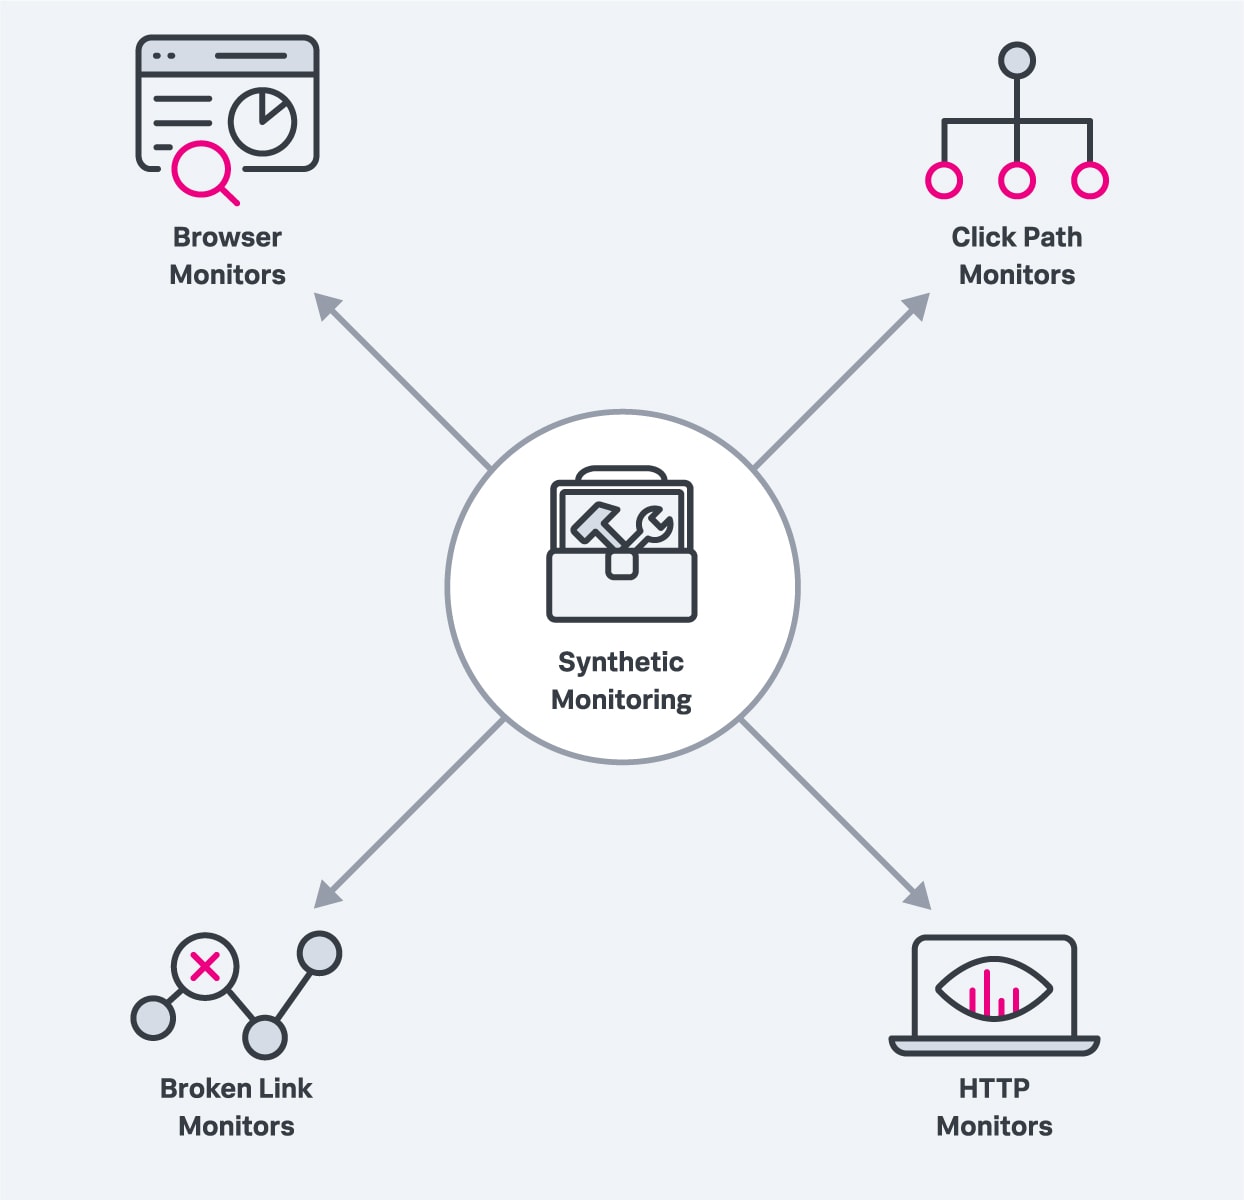
Synthetic monitoring checks are performed at regular intervals, and the frequency of these checks is typically determined by what is being checked. Availability, for example, might be checked once every minute. You can set up all sorts of monitors:
- Browser monitors: A real browser monitor simulates a user’s experience of visiting your website using a modern web browser. A browser monitor can be run at frequent intervals from multiple locations and alert you when your site or application becomes unavailable or when performance degrades below the baseline.
- Click path monitors: Click path monitors also simulate a user’s visit to your site but monitor specific workflows. They allow you to create a custom script that navigates your website, monitoring a specific sequence of clicks and user actions, and which can be run at regular intervals.
- Broken links monitors: These monitors allow you to create scripts that will test all the links for a specific URL. All failures are reported so you can investigate the individual unsuccessful links.
- HTTP monitors: HTTP monitors send HTTP requests to determine the availability of specific API endpoints or resources. They should allow you to set performance thresholds and be alerted when performance dips below the baseline.
(See how synthetic monitoring & web analytics work together.)
Comparing synthetic & real user monitoring
Similar to real user monitoring (RUM), synthetic monitoring differs in how it’s done: it is synthetically generated by a programmable script that emulates user behavior and actions. In fact, the key benefit versus real-user monitoring is that synthetic monitoring can emulate certain client-server interactions that occur rarely or never in the real world.
Indeed, it is this unique capability that extends performance monitoring and testing coverage across all features and functions of your Web service, identifying performance issues and opportunities that you would otherwise not notice.
Furthermore, user-specific scenarios allow IT teams to proactively identify performance issues and introduce performance improvements. The monitoring process can be modular and designed to generate insightful performance monitoring data on unique usage scenarios.
(Go deep into the differences in synthetic vs. real user monitoring.)

Components in synthetic monitoring
A simple synthetic monitoring simulation design includes three components:
- Agent nodes that actively probe a web service component
- A scenario generation component that describes the characteristics of the environment for the client-server transaction
- A dynamic web service component that simulates the workload through the assigned environment characteristics.
In synthetic monitoring, you can program a script to generate client-server transaction paths for a variety of scenarios, object types and environment variables. The synthetic monitoring tool then collects and analyzes application performance data along the customer’s journey of interacting with your application or web server:
- A synthetic agent actively probes the target web service component to generate a transaction response.
- Once the connection is established with the target, the tool collects performance data on actions that are typically performed by an end-user.
(Get examples, screenshots & more details on must-have features in synthetic monitoring.)
Delay scenarios in client-server comms
Let’s consider various delay scenarios for the client-server communications.
A global delay that may be caused by a network outage or dependency issue. It creates a significant delay in response time for all users. An example of the global delay scenario is a new feature release that introduces a slow database query that is overlooked by the QA.
A partial delay that may only affect some part of the web service infrastructure. An example is a hardware issue that affects the load balancer, which means that all servers now share a partial delay due to the issue on one server.
A periodic delay that occurs repetitively – and perhaps at irregular intervals. An example is periodic data backups that occupy the network bandwidth and introduce delays during peak usage intervals.
The synthetic monitoring agent emulates the behavior of a real-user and allows the synthetic monitoring tool to collect data on predefined metrics such as availability and response time. This agent follows a programmable test routine. The configurations of this routine may include:
- Identifiers of the web service components that need to be tested
- The sequence of processes, activities and interactions between the agent and the web service
- Data sampling interval and testing duration
The scenario generation component injects a variety of testing scenarios that reflect the performance degradation or network outages. It may also specify how various agents are distributed to simulate a global user base accessing a web service through different data centers, as well as developments and changes in these circumstances.
Areas and outputs to look for
The output of synthetic monitoring reports may be visual or time series data observations. You can then further analyze these outputs using a variety of statistical analysis and machine learning methods. Analysts typically look for:
- Spikes as extreme performance issue indicators in response to a sudden surge in data traffic.
- Periodic indicators such as regular delays in response to a client agent-service request.
- Trends that suggest gradual but consistent change over the time series data observations.
- Outliers that can be considered anomalous behavior. It may require further analysis to determine the significance of the outliers as well as a cost-performance benefit analysis of addressing outlier issues.
- Exploratory analysis evaluates the change in time series observations prior to and following an issue or agent action.
- Changepoint analysis that takes a moving average of the data; this knowledge is often evaluated in connection with the trends analysis. It allows analysts to evaluate significant changes over the course of the user experience journey.
- Feedback cycle that plans for future monitoring scenarios, based on the knowledge obtained from present observations.
Active agent probing can be used for a variety of monitoring types, including API monitoring, component monitoring, performance monitoring and load testing, among others.
The key idea is to emulate a real-world usage scenario on-demand. These interactions may be infrequent and available sporadically.
Challenges in synthetic monitoring
A major challenge facing synthetic monitoring is the validity of assumptions that go into producing a usage scenario. That is — we cannot assume we know what a user might do. In a real-world setting, users may behave unexpectedly. The scenario generating component, described above, may not be able to emulate an exhaustive set of complex real-world scenarios.
Still, you can mitigate these limitations. By combining synthetic monitoring with real-user monitoring, you’ll get the ideal view: you’ll get to look at the data produced by synthetic monitoring alongside information from real user monitoring — to make a well-informed and realistic statistical analysis.
What is Splunk?
This posting does not necessarily represent Splunk's position, strategies or opinion.