 By Stephen Watts July 10, 2023
Real-time data is data that is available as soon as it’s created and acquired. Rather than being stored, data is forwarded to users as soon as it's collected and is immediately available — without any lag — which is critical for supporting live, in-the-moment decision making.
This data is at work in virtually every part of your lives, powering everything from bank transactions to GPS to emergency maps that are built whenever a disaster occurs
Real-time data is especially valuable for businesses. Collecting and analyzing big data has become easier and cheaper over time, so organizations focus more and more effort on accelerating this process. Businesses use real-time data across the enterprise to:
- Respond to customers and improve customer service.
- Manage products.
- Optimize operations.
Perhaps the most valuable use of real-time data is to help monitor and maintain IT infrastructure. Real-time data enables organizations to obtain more comprehensive visibility and insight into the performance of their complicated networks.
To uncover the benefits of real-time data in infrastructure monitoring, let's look at how it’s collected and processed, the kind of insights it can provide and the kind of outcomes you can expect when you tap into this powerful tool.
How real-time data processing works
Real-time data processing (aka data streaming) refers to a system that processes data as it’s collected and produces near-instantaneous output.
To understand the advantages it offers, it’s important to look at how data processing works and contrast real-time data processing with another commonly used method: batch data processing. The goal of data processing is to take raw data (from social media, marketing campaigns and other data sources) and translate it into usable information and, ultimately, better decisions.
In the past, this task was performed by teams of data engineers and data scientists. Today, however, much of data processing is done by AI and machine learning (ML) algorithms. While the nature of processing indicates at least some kind of time delay, the speed or lack of "heavy" processing or near parallel processing provides a faster, as well as more complex, analysis.
There are six steps for turning raw data into actionable insights, which are repeated cyclically.
- Collection: Gathering data is the first step in the processing cycle. Data is collected from data warehouses, data lakes, online databases, connected devices or other sources.
- Preparation: The data is “cleansed” to remove corrupt, duplicate, missing or inaccurate data and organized into a suitable format for analysis. This helps ensure that only the highest quality data is processed.
- Input: The raw data is converted into a machine-readable form and fed into the processing system.
- Processing: The raw data is processed and manipulated using artificial intelligence (AI) and machine learning algorithms to generate the desired output.
- Output: The processed data is passed on to the user in a readable form such as documents, audio, video or data visualizations.
- Storage: The data is stored for future use. It can be easily retrieved when information is needed, or used as an input in the next data processing cycle.
(Read about managing the data lifecycle.)
Batch vs real-time data processing
Batch processing and real-time processing both follow these steps, but they differ in the way they’re executed, which makes them suited for different uses.
Batch data processing is commonly used for handling large volumes of data. In this method, the steps are:
- Data is gathered over a certain period of time and stored.
- Once data is entered into the system, it's processed in bulk.
- Once processed, a batch output of data is produced.
Batch data processing has several advantages. It’s ideal for processing large volumes of data. There is no deadline to be met, so data can be processed independently from collection at a designated time. And because data is processed in bulk, it’s highly efficient and cost-effective. The one major drawback is a delay between data collection and the result yielded from the processing, making it ideal for processing accounting data, such as payroll and billing.
In real-time processing, data is processed in a very short time to produce a near-instantaneous output. Because this method processes data as it is put in, it requires a continuous stream of input data to produce a continuous output.
Latency is much lower in real-time processing than in batch processing and is measured in seconds or milliseconds. This is attributed, in part, to steps that eliminate latency in the network i/o, disk i/o, operating environment and code. Also, “formatting” the incoming data can be seen as an impediment or heavy lift for users and customers. Real-time data processing is at work in many daily activities, such as:
- ATM transactions
- e-commerce order processing
Speed is one of the main benefits of real-time data processing: there is little delay between inputting data and getting a response. It also ensures that information is always current. Together, these features enable users to take accurately informed action in the minimum amount of time.
However, real-time data processing uses big data analytics and computing power, and the associated cost and complexity of these systems can make them prohibitive for organizations to implement on their own.
Example: real-time data visualizations
Visualizations are used to help administrators understand and interact with data, by allowing various types of information to be plotted, coded or worked with in a way that is easily understandable or tailored by the reviewer to help with the resulting decision or action. They can vary from a simple bar graph to more complex graphics. Some common real-time data visualizations used to display infrastructure data include:
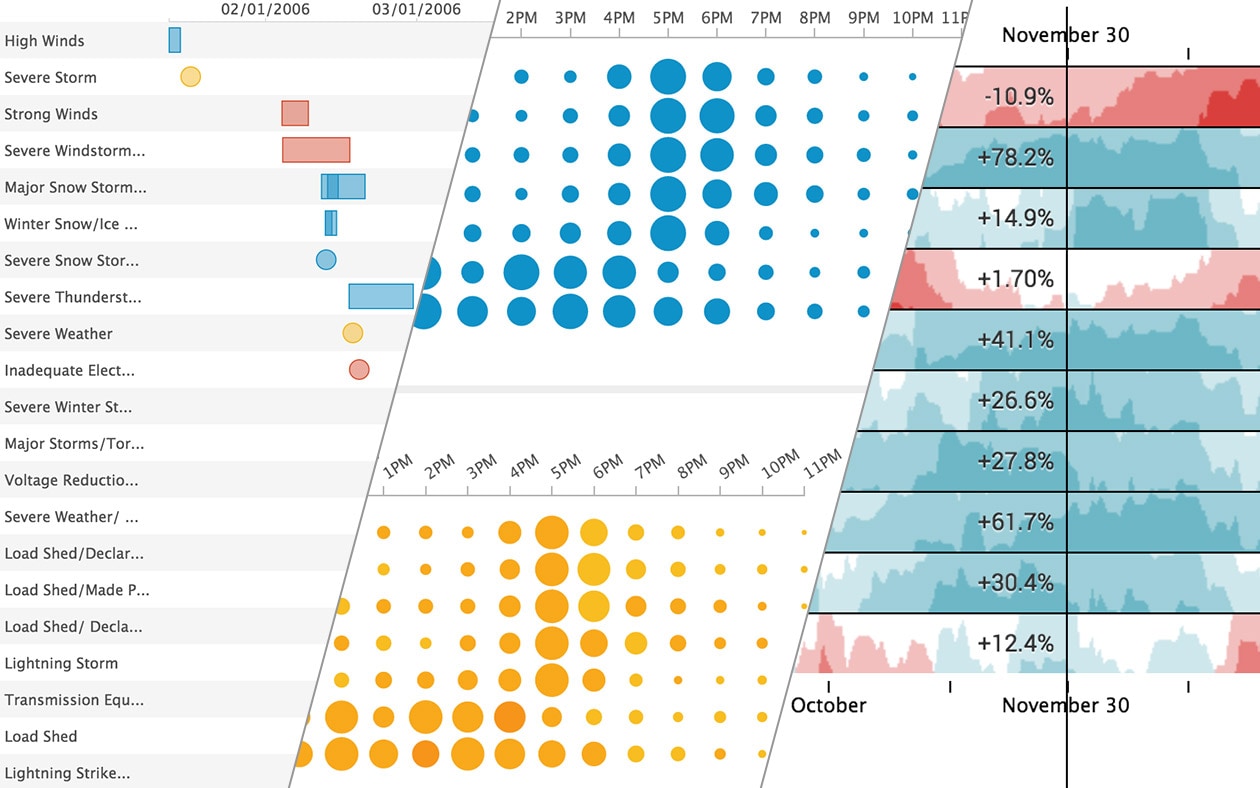
- Timelines display the duration of processes. They can be used to monitor batch processes and investigate long-running processes and similar operations.
- Punch cards display circles representing a metric aggregated over two dimensions and allow you to see cyclical data trends. For example, IT can use a punch card to visualize hours of the day and days of the week to plan resources.
- Horizon charts display metric behavior over time in relation to a baseline or horizon. It allows you to track metric changes above and below a horizon for several data series in one chart. Horizon charts are great for monitoring network activity and for benchmark analysis.
Example: Real-time data visualization
Benefits of real-time data
Real-time data offers a range of benefits for organizations of any size. Here are just a few:
- A more proactive approach. For decades, data analytics has been a reactive process. Current technology, however, enables a more proactive posture through data mining, predictive strategies and machine learning algorithms to identify patterns that weren’t easily uncovered using previously available methods and tools.
- Greater visibility. Modern IT infrastructures are a heterogeneous mix of physical and virtual servers, public and private clouds, databases and applications with complex interdependencies — all of which create a host of visibility challenges for IT teams. Real-time data coupled with a unified monitoring and analytics tool provides teams with a single, comprehensive view into their environment and makes it easier to correlate data across elements and produce actionable insights.
- Reduced downtime. Real-time data provides the grist to predict, prevent or detect failing components, service spikes, security threats and other infrastructure issues. By anticipating or quickly identifying these types of problems, teams can resolve them before they significantly impact customers.
- Cost savings. Real-time data analytics helps reduce IT infrastructure costs by giving administrators more insight into resource allocation and consumption, system health and security weaknesses, among other things. With the opportunity to optimize infrastructure elements, ITOps can achieve significant cost savings.
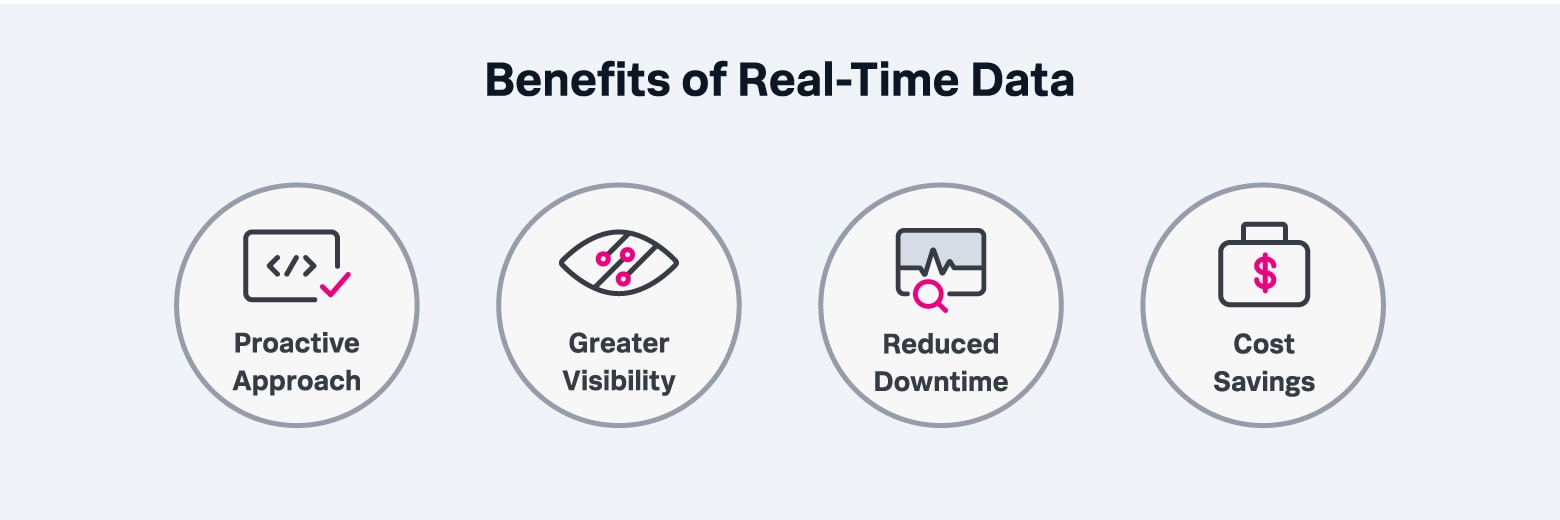
Benefits of real-time data include proactive approach, greater visibility, less downtime & savings.
Real-time data becomes real-time analytics
Now we've come to the real goal: what we use real-time data for. Real-time data is used primarily to drive real-time analytics — the process of turning raw data into insights as soon as it’s collected.
Analytics produces immediate insights that organizations can act on quickly. Real-time analytics takes an input stream of data and processes it using machine learning algorithms and other automation technologies to transform it into usable information. If it’s stream analytics, it can change the display of information based on the real-time data, which can be a point in time or viewed historically to understand larger trends.
Also called business intelligence or operational intelligence, these analytics can be used across industries in any scenario where a quick response is critical. Some examples of real-time use cases include:
- Financial institutions that use real-time analytics for credit card fraud detection as the transaction is taking place.
- ITOps teams can predict a device failure with real-time analytics.
- Virtually any complex task that requires immediate insights can benefit from real-time analytics.
There are two types of real-time analytics:
- On-demand analytics requires an end user or system to create a query after which the analytic results are delivered.
- Continuous analytics, also called streaming data analytics, analyzes data as it is collected and alerts users or triggers a response to detected events.
As mobile devices, IoT endpoints, sensors and other sources create more data at greater speeds, real-time analytics has become increasingly essential, as it allows a constant flow of data to be processed in motion rather than after it’s stored.
What we can learn from real-time data
Real-time data can be processed to extract many different types of insights, ranging from customer behavior and response time to customer experience and ways to achieve a competitive advantage. Analytics is a view “in” on what’s happening in a defined space or zone — what you do with it is the “type.” In short, an analytics tool doesn’t conduct a specific action but instead provides insight based on a bounded input. There are four basic types of data analytics:

Descriptive
Descriptive analytics identifies a problem or answers the question “What happened?” However, while descriptive analytics can accurately describe a problem, it can’t explain why it happened, so it is often used in conjunction with one or more of the other types of analytics.
Diagnostic
Diagnostic analytics goes a step further, diving deeper into data to make correlations that explain why something happened, such as what caused a system to fail or how a security threat was able to enter the environment. Diagnostic analytics can definitely overlap with root cause analysis.
Predictive
Predictive analytics takes historical data — the product of descriptive and diagnostic analytics — and considers it against significant patterns and trends to predict what is likely to happen in the future. In an infrastructure context, predictive analytics can alert administrators to potential system failures, helping them achieve higher availability over time.
Prescriptive
Prescriptive analytics is the most sophisticated type of data analytics. As its name indicates, it suggests the course of action to take to prevent a problem. Prescriptive analytics uses machine learning and other algorithms, basing its output on:
- Past and current performance
- Available resources
- Likely scenarios
Prescriptive analytics can help drive infrastructure development over time by suggesting ways to make infrastructure more durable and resilient.
Getting started: Turning real-time data into real business value
Typically, companies begin leveraging real-time data and analytics to increase their operational uptime, which directly affects revenue. Processing real-time infrastructure data enables IT administrators to:
- Detect system faults before they impact customers.
- Predict and prevent errors altogether. (A significant advantage when the average hourly downtime cost of a single enterprise server is as high as $400,000.)
- Anticipate service spikes and lulls and help adjust resource allocation to meet customer demands.
- Provide up-to-date insights about network security issues, allowing organizations to immediately act on threats.
In short, it creates “real-time” awareness that allows you to “act as it happens,” as opposed to taking a reactive approach.
Perhaps the greatest value real-time data offers is its ability to drive infrastructure improvements. Over time, data analytics can move beyond the reactive mode of detecting and diagnosing issues to predicting events and suggesting measures to prevent them that lead to a more capable and more resilient infrastructure.
Best practices for real-time data analysis
While all these approaches to analyzing real-time data have a place in monitoring and managing your IT infrastructure, there are several best practices that will ensure you get the outcome you want.
Before you start, it’s important to determine what you want to measure. Resist the temptation to attempt to track everything, as you will spend more time managing data than obtaining insights. Instead, have stakeholders identify what questions need to be answered or what problems need to be solved and track the associated information.
Once you’ve determined what infrastructure data to track, you’ll need an analytics tool. These software platforms do the grunt work of collecting the relevant data from its various sources and processing it in real time using either pre-trained or customized machine learning models.
Next, the raw data has to be contextualized and related to desired outcomes to surface actionable insights. Again, an infrastructure analytics tool will transform raw numbers into digestible information, help make data understandable from multiple perspectives and generate visualizations to communicate ideas. (Also, visualizations, while powerful, are only one part of the communication channel that will need to be related to the audience to support decision making.) While it might be easy to assume that all stakeholders or parties involved are motivated by the same thing, an infrastructure analytics tool will help you ascertain if those looking at the data have similar goals and desired outcomes.
Finally, you should evaluate and draw conclusions from the derived insights and decide on a course of action. In addition to responding to the initial situation, you can use insights extracted from data to reduce the occurrence of negative events, as well as help identify conditions and events you wish to happen again in the future.
Is real-time data being used beyond analytics?
The immediacy of real-time data makes it popular across a wide array of industries and applications. Construction can better understand supply chain and other trends. In healthcare, real-time data is used for issues like monitoring patient vitals, diagnosis and treatments “at the point of care” instead of waiting. And real-time data allows utility providers to adjust for load and demand issues rather than dealing with a potential, unexpected failure.
Real-time data is behind many of the apps and services that inform our daily lives. It is critical to the accuracy of weather apps and hurricane and earthquake monitoring systems. It’s also what allows us to get up-to-the-minute election results, traffic updates and geographical COVID-19 data.
In short, real-time data is used everywhere there’s a need to make informed decisions quickly.
Real-time data warehouses
Yes, and there are even real-time data warehouses! These are storage systems where real-time data is stored and analyzed. Data is automatically captured as it’s made available, before it’s immediately analyzed and correlated to historical data already warehoused.
Ultimately, the faster you can get it in, the faster you can look at and analyze it. Then, an output is produced that identifies issues or illuminates trends that can inform the user's actions. Data warehouses often include templated report formats so users can pull structured and unstructured data from it.
Benefits & risks
Real-time data warehouses offer some advantages over traditional data warehouses. The biggest is that they enable faster decision making. Because the data is automatically processed in real time, there’s no reason to put off critical decisions. Insights are available whenever needed. And unlike traditional data warehouses, where data is loaded daily or weekly, real-time data warehouses ingest a continuous stream of data. That means there’s no risk of acting on outdated information. The most current data is always at your fingertips.
Real-time data warehousing also presents its share of challenges. One of the biggest is the performance of ETL tools, which usually operate in batch mode. Batch mode time consuming and requires warehouse downtime that makes data unavailable. Fortunately, there are real-time ETL tools and ETL system modifications that can help get around this limitation.
Real time data will unlock your infrastructure
Real-time data is the key to understanding your environment “as it happens” and ensuring it performs at its highest capabilities. With a real-time analytics solution, you can transform the volumes of data your environment produces into operational information that drives infrastructure improvements. And a healthier infrastructure will result in happier customers and better business results.
What is Splunk?
This posting does not necessarily represent Splunk's position, strategies or opinion.