 By Splunk February 07, 2022
 OpenTelemetry enables Observability, and building observable systems requires you to understand the various ways in which they can fail. Jumping from one possible fix to another and one change to another without fully recognizing the impact on the system can be a significant hindrance to a successful customer experience. In this post, I’ll explain how to get started with OpenTelemetry to help you make your systems more observable.
Why is Observability Needed?
The adoption of cloud-native workloads has become widely adopted by many organizations. In parallel, this has many questioning their current monitoring stack and the need to evolve to Observability. Traditionally, monolithic systems have fewer components, making it easy to understand these systems. However, modern distributed systems require more than just monitoring CPU, memory, databases, and networking conditions. Distributed systems require a move to Observability. Observability is the ability to measure the internal states of a system by examining its outputs, using three types of telemetry data: metrics, traces and logs. These metrics help DevOps teams responsible for these systems have deep visibility into these cloud-native systems and their dependencies, get to the root cause of their application issues and improve the system’s performance.
As a DevOps engineer, you know how challenging it can be to find a solution to understand your cloud-native workloads best. With many options available that require you to use a proprietary agent that locks your data to their instrumentation standards, consider a vendor-neutral open standard framework, like OpenTelemetry.
OpenTelemetry is about owning and controlling your data by offering a single set of APIs and libraries that help you standardize how you collect and transfer telemetry data to backends of your choice, like Splunk.
To help you get started with OpenTelemetry, I will cover the basic configuration steps on how to deploy the Splunk OpenTelemetry collector to gather metrics and begin analyzing the performance of your infrastructure. In another post, How to Deploy the Splunk Observability Collector to Gather Kubernetes Metrics, I explain how to do this with Kubernetes environments – this post will cover the standalone use case.
How to Deploy the Splunk OpenTelemetry Collector
The distribution of the Splunk OpenTelemetry collector uses the open-source OpenTelemetry collector core as its upstream along with a few additional components that can help you with a more robust experience when using the Splunk Observability back-end for analysis of cloud-native workloads. Included as part of the deployment process is a script to help you easily deploy the collector and get started quickly.
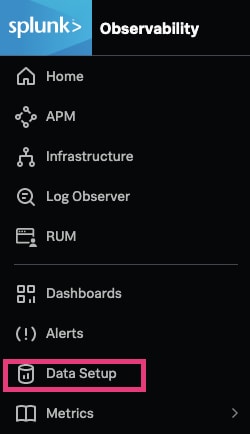
To begin the deployment of the Splunk OpenTelemetry Collector, log into the Splunk Observability console. Once logged in, navigate to the hamburger menu on the top left-hand corner and click "Data Setup".
In the Connect Your Data window, select Splunk OpenTelemetry Collector, click the operating system version you would like to install the collector on and click Add Connection. For this example, we will use Linux. This will then present the data setup wizard, which walks you through the various installation requirements.
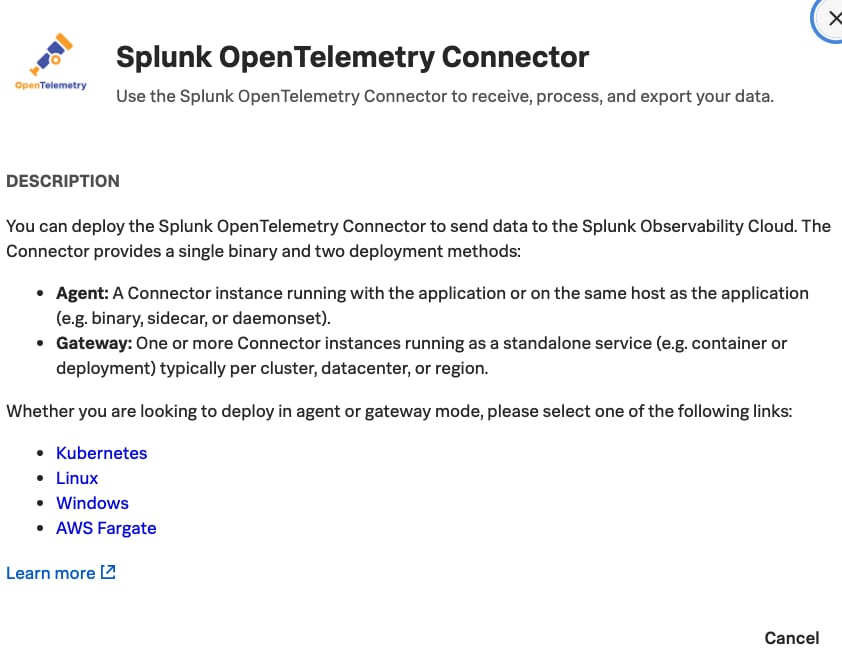
Screen shot taken in light mode for better visibility
Next, we must choose which access token and deployment mode we would like to use for this deployment.
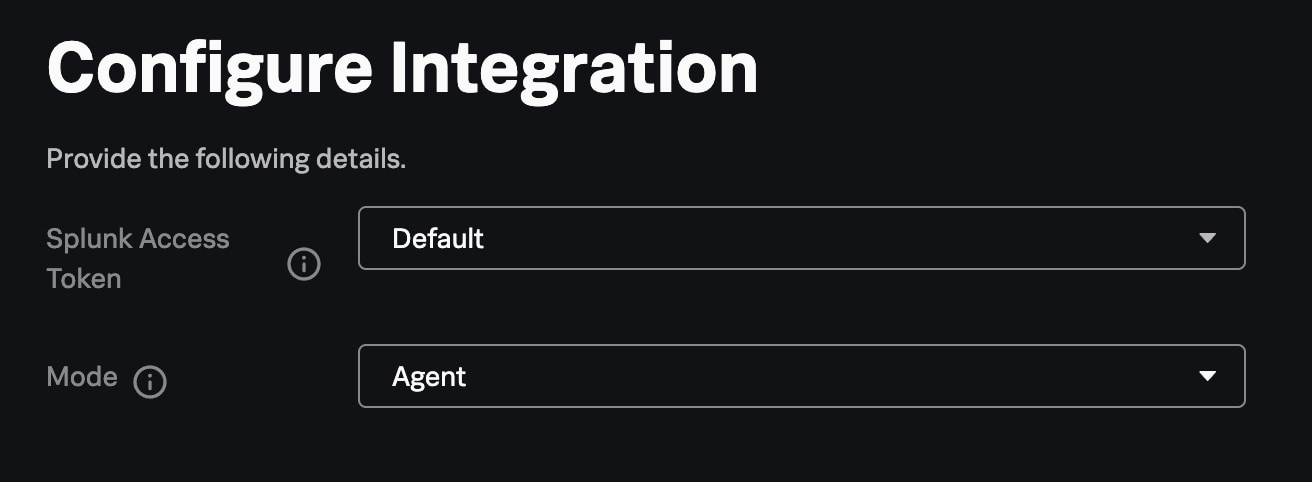
By default, one access token is created when you sign up for Splunk Observability Cloud. You can, however, create multiple access tokens. Access tokens are used to authenticate the integration with Splunk Observability Cloud and can be helpful when tracking usage for different groups of users. By default, these tokens can persist for five years and be used for API calls that continually send data points to Infrastructure Monitoring—more on managing access tokens here.
Deployment mode: allows you to select the type of deployment for your collector.
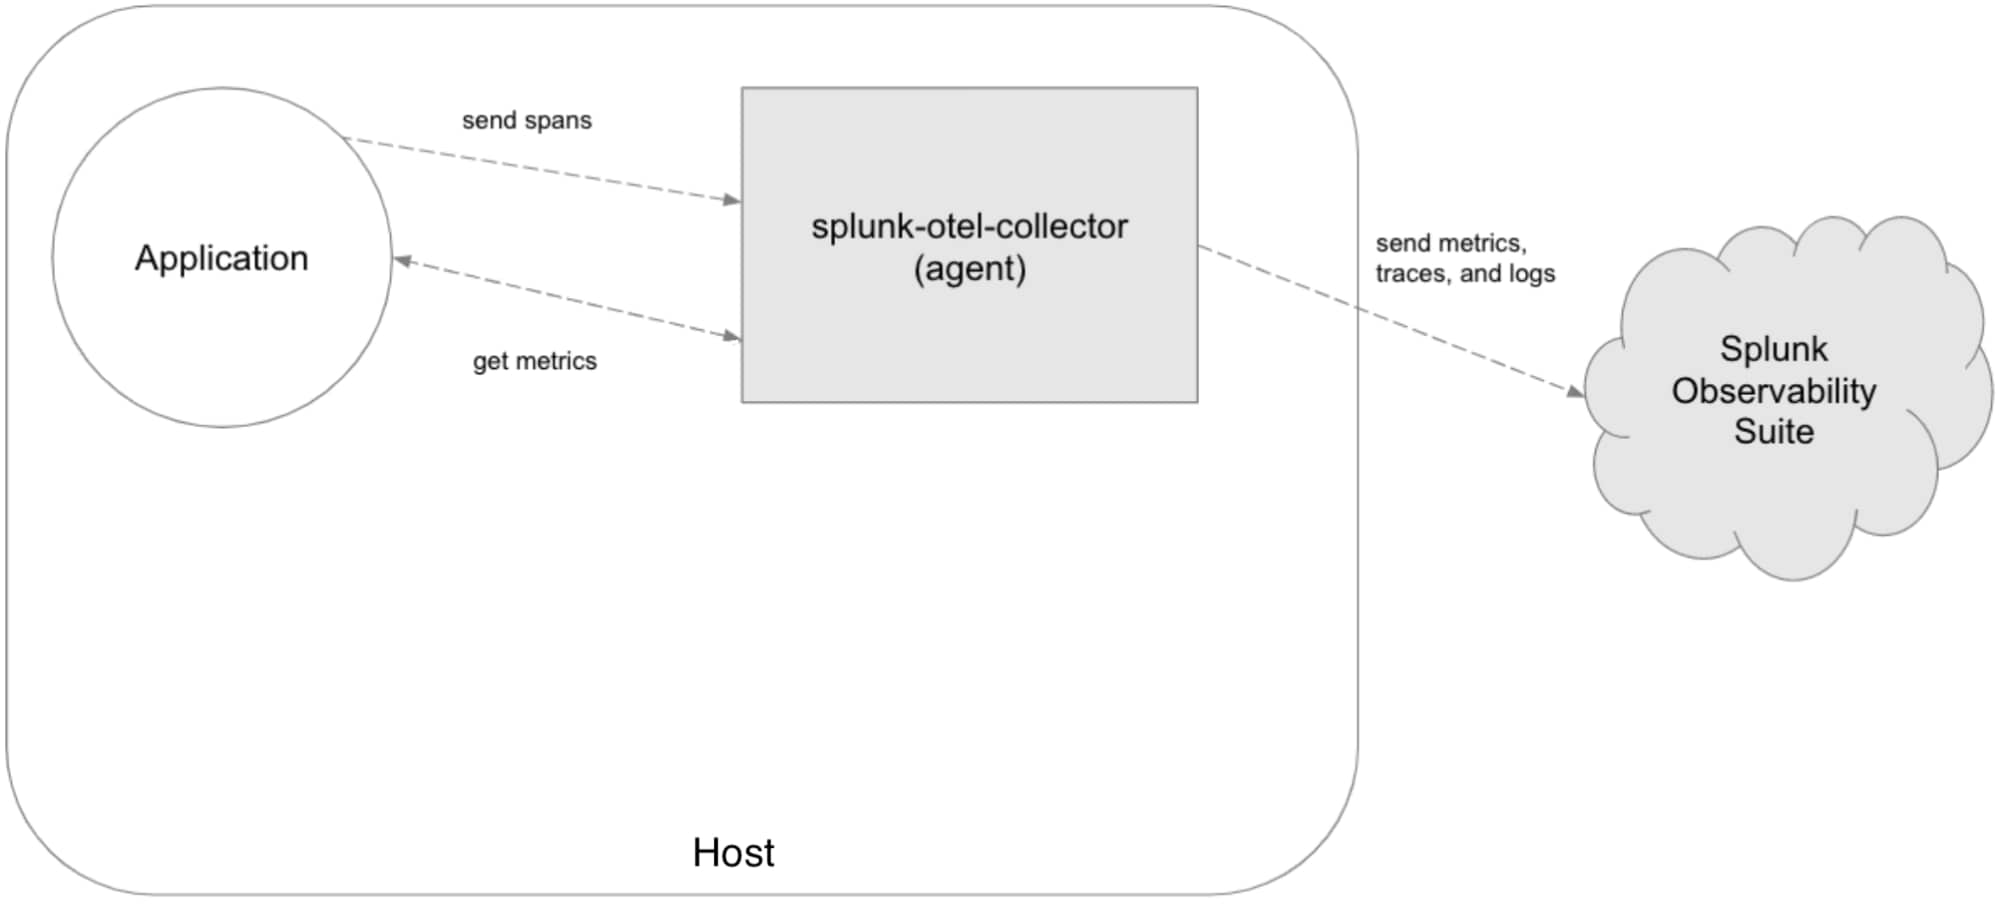
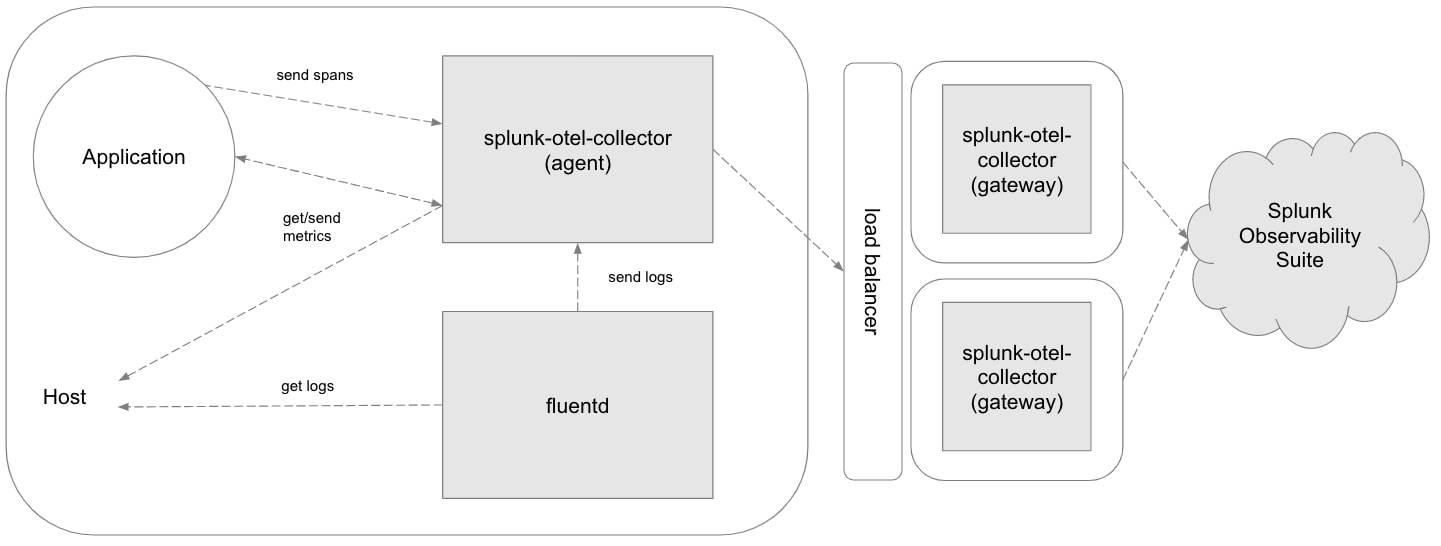
Agent: Will deploy the Splunk OpenTelemetry Collector instance running with the application or on the same host as the application. The diagram below shows a sample architecture of a standalone deployment.
Gateway (Advanced): Deploys one or more Splunk OpenTelemetry Collector instances running as a standalone service, typically per cluster, datacenter, or region. One common reason for deploying gateways is when hosts running the Splunk OpenTelemetry Collector cannot reach Splunk Observability Cloud. Standalone agents are then configured to send gathered telemetry directly to the gateway to be exported to Splunk Observability Cloud. The diagram below shows a sample architecture of a gateway deployment.
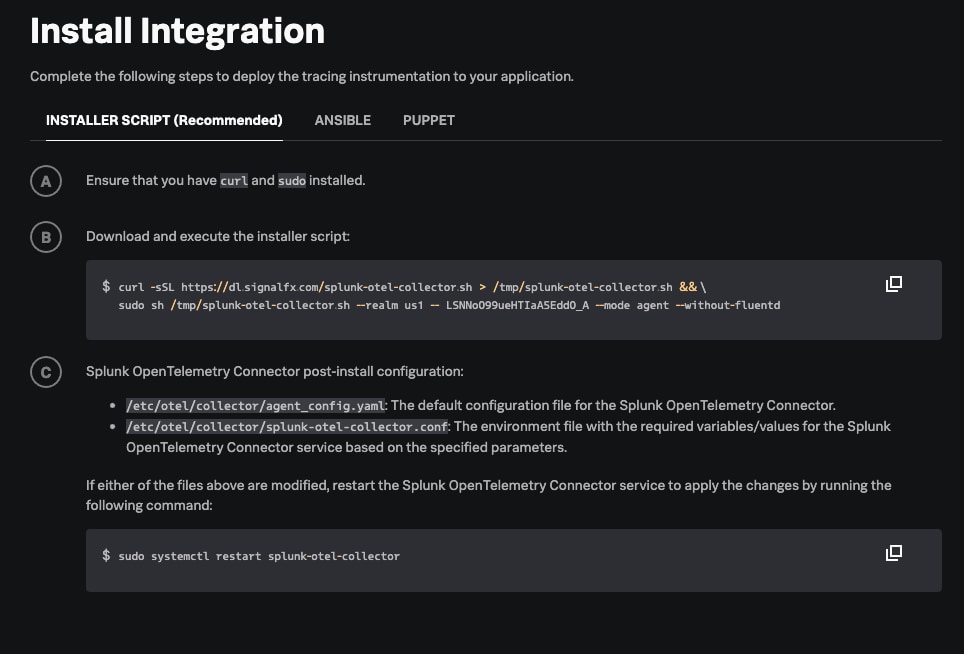
After selecting your access token and deployment type, you are prompted with an installation script specific to the operating system you have chosen for deployment. Since our example uses Linux, you can see the commands needed to complete the installation from the example below. Copy and paste the code shown in the Install Integration wizard to complete the installation.
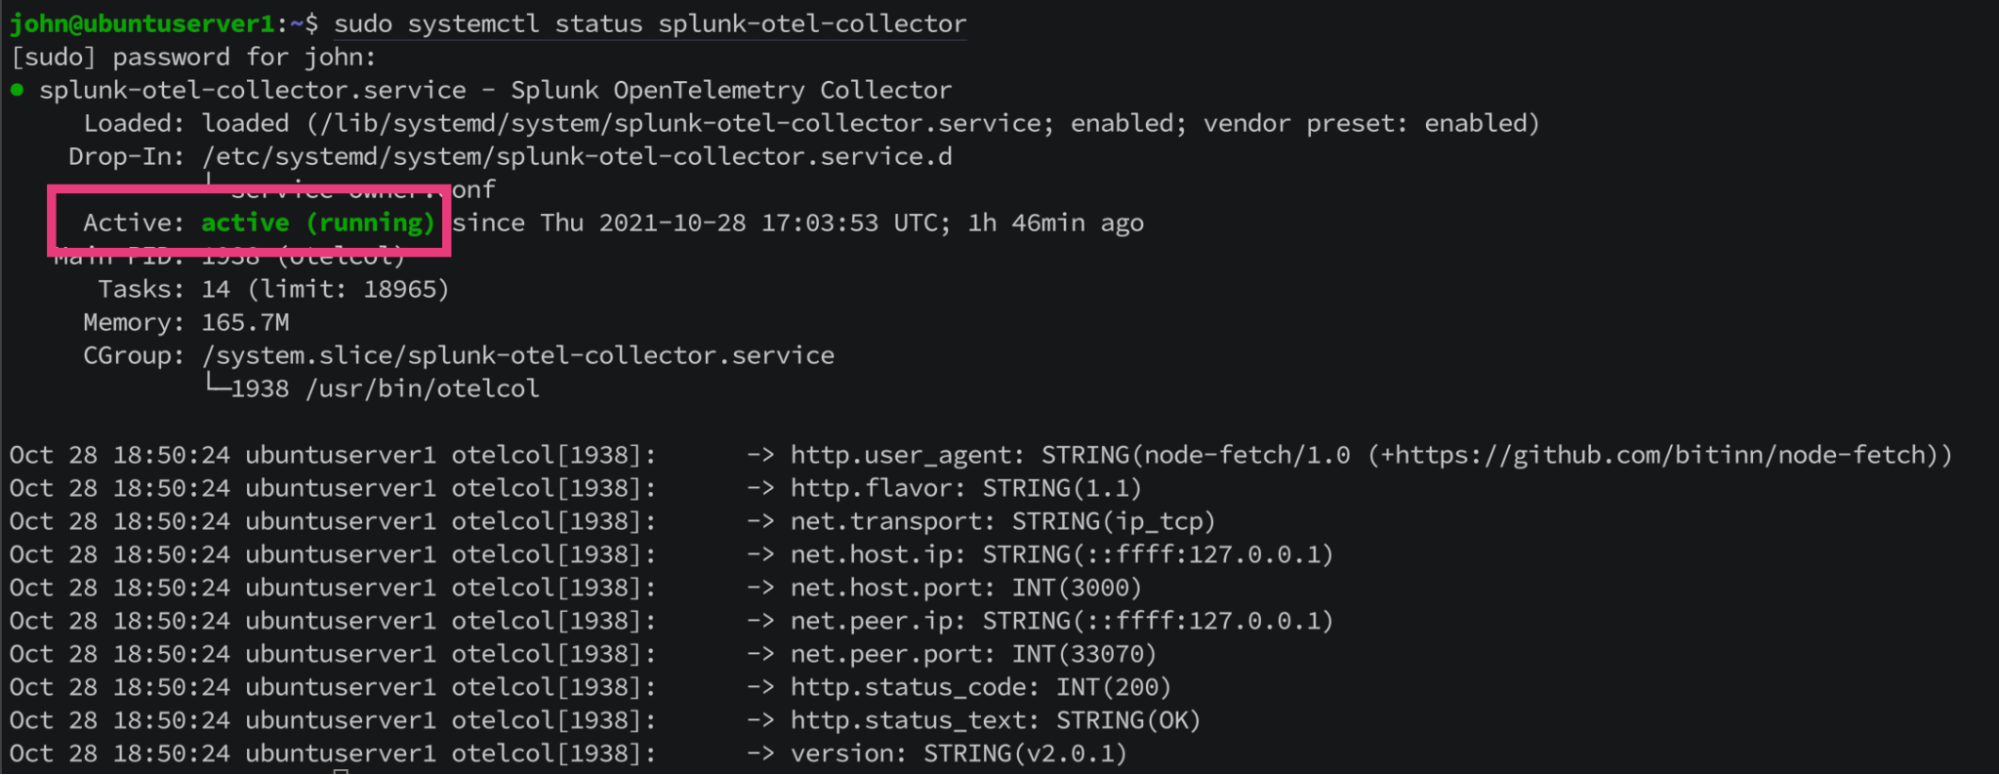
Using sudo systemctl status splunk-otel-collector, we can confirm the installation of the Splunk OpenTelemetry Collector has been successfully deployed.
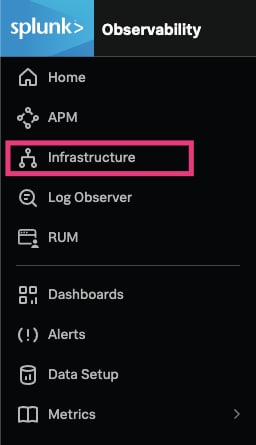
After about 90 seconds, data begins to populate metrics from your host on to Splunk Observability Cloud. To verify, let’s navigate to the infrastructure dashboard by clicking the hamburger menu and selecting Infrastructure.
Click on My Data Center to confirm your host is successfully sending metrics correctly.
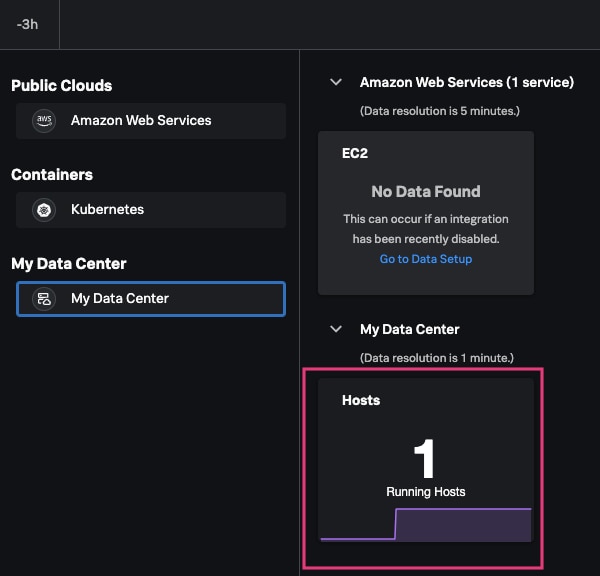
The dashboard now shows your host metrics, providing you with easy to understand charts and filter options for easy customization.
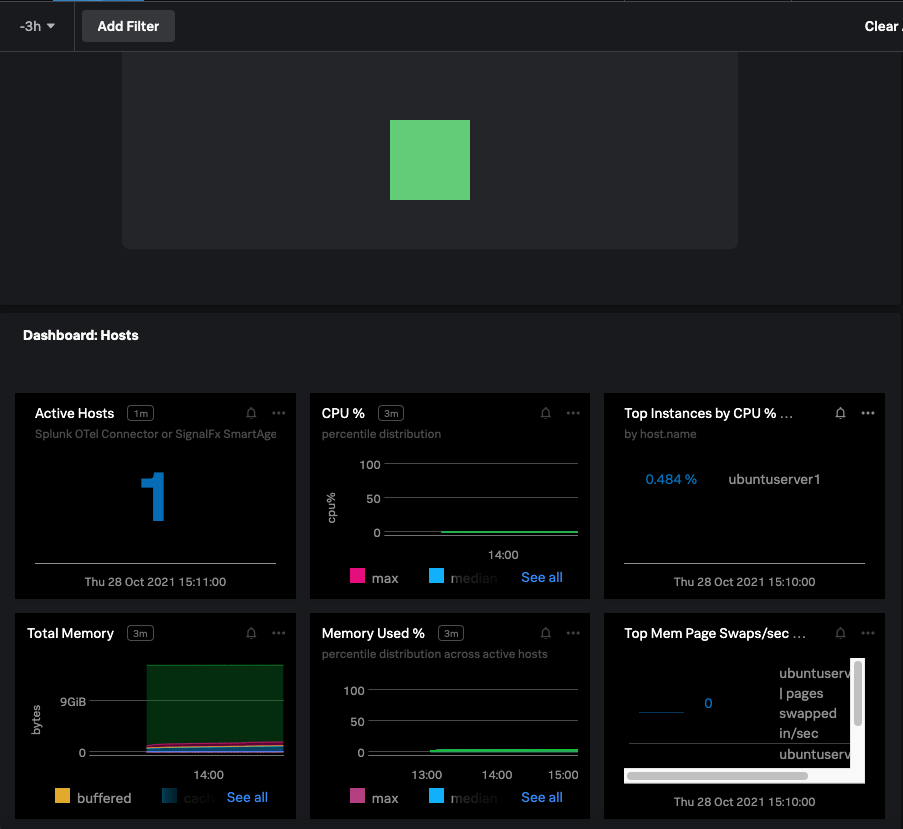
Now that the Splunk OpenTelemetry Collector is successfully exporting metrics from your host to Splunk Observability Cloud, you can easily use the various metrics collected to identify any potential infrastructure issues affecting your application workloads.
Conclusion
Choosing the best Observability solution can be challenging with the many options available. Why not future-proof your infrastructure monitoring set up, and keep control of your data with OpenTelemetry.
Start working with OpenTelemetry and Splunk today! You can sign up to start a free trial of the suite of products – from Infrastructure Monitoring and APM to Real User Monitoring and Log Observer. Get a real-time view of your infrastructure and start solving problems with your microservices faster today. If you’re an existing customer who wants to learn more about OpenTelemetry setup, check out our documentation.
----------------------------------------------------
Thanks!
Johnathan Campos