 By Chrissy Kidd November 10, 2023
When all your IT systems, your apps and software, and your people are spread out, you need a way to see what’s happening in all these minute and separate interactions. That’s exactly what distributed tracing does.
Distributed tracing is a way to tracking requests in applications and how those requests move from users and frontend devices through to backend services and databases.
Distributed tracing enables you to track requests or transactions through any application you monitor — giving you vital information that supports uptime, issue and incident resolution, ongoing optimization and, ultimately, a pristine user and customer experience.
In this article, let’s take a long look at distributed tracing and the technologies used to make it possible in your enterprise.
Metrics, logs, traces: Pillars of observability
Managing modern software environment hinges on the three “pillars of observability”: logs, metrics and traces. (Sometimes events is included in this: MELT.) Each of these is a data source that provides crucial visibility into applications and the infrastructure hosting them. This practice is often known as application performance monitoring (APM), one type of IT monitoring.
For many IT operations and site reliability engineering (SRE) teams, two of these pillars, logs and metrics, are familiar enough. For decades, teams have analyzed logs and metrics in order to:
- Establish baselines of normal application behavior.
- Detect anomalies that could signal a problem.
- Further investigate issues as necessary.
It’s the third pillar— traces — that may be less familiar.
What is a trace? Why is it important?
Tracing is not a new concept. A trace is a collection of transactions (spans) that represent a unique user or API transaction that is handled by an application and its constituent services.
Tracing starts the moment a user interacts with an application. You send an initial request — adding an item to your cart, for example — and that is assigned a unique trace ID. One trace represents one user interaction. As the request moves through the host system, every operation performed on it (span) is tagged a few items:
The trace is made up of a collection of spans — each span a single operation, which contains:
- A beginning time and an ending time
- A trace ID to correlate them to the specific user transaction involved
- Some identifier or tag to add additional information about the request, like the particular version of microservice that generated the span.
Each span represents one segment of the request’s path. So, each span includes important information related to the service performing the operation, such as:
- The name and address of the process handling the request.
- Logs and events that provide context about the process’s activity.
- Tags to query and filter requests by session ID, database host, HTTP method, and other identifiers.
- Detailed stack traces and error messages in the event of a failure.
Teams who develop and manage monolithic applications have long used traces to understand the performance of applications:
- How applications process requests.
- How to trace performance problems to specific lines in the application source code.
The fundamental goal behind tracing — understanding transactions — is always the same. But the way we do it changes. It doesn’t work, though, when used with applications built on a distributed software architecture, such as microservices.

Traditional tracing vs. distributed tracing
Let’s first look at traditional tracing, how it used to work, and then we can start to understand why this isn’t a great solution today.
Traditional tracing
In old-school applications that ran as monoliths, tracing was possible, but the need to understand what was happening was less important: There were fewer moving parts through which requests had to flow as the application processed them. So, less to trace.
The tracing tools that did exist performed probabilistic sampling. This captures only a small — and arbitrary — portion of all transactions. Probabilistic sampling provides a little insight into what is happening. But because it’s only taking samples of transactions, not looking at all of them, you don’t have full visibility. For example, tracing with sampling would, at best, allow IT and SRE teams to:
- Understand general trends associated with the most common types of user requests.
- See significant changes in performance, such as a complete service failure that causes all of the sampled transactions to result in errors.
This approach, however, would not yield more nuanced performance trends. It certainly cannot scale enough to measure the thousands of distributed services in a transient containerized environment. For example:
- A slight degradation in performance, like an increase in average latency from 1 second to 1.2 seconds for users hosted in a particular shard of the backend database, may go undetected. This is because the traditional APM tool may not be capturing enough transactions to identify this change.
- Errors that result from some transactions due to certain types of user input may go unnoticed. That’s because the errors would not appear frequently enough in the sampled data to become a meaningful trend.
(You can quickly see that this won’t work with the ephemeral nature of distributed systems that causes other unrelated alerts to happen can exacerbate troubleshooting. For example, if an EC2 node fails and another replaces it. If it only affects one user request, is that worth alerting about? As a result, the team would not identify these issues until they grew into major disruptions.)
Now, this might be all well and good for you if you’re working in a static, monolithic environment. But chances are, your environment is significantly more complex and constantly changing.
Modern tracing: how traces in microservices work
A single user transaction fans out to interact with tens or hundreds of microservices, each one requesting data from backend data stores, interacting with each other via APIs, or interacting with other parts of your infrastructure. (Think of it as software using software.)
By design, microservices scale independently from one another. It’s perfectly normal to have multiple instances of a single service running at the same time on different servers, in different locations and different environments. And each microservice can run on multi-layered stacks made up of:
- Servers
- Application code
- Containers
- Orchestrators
- And more
Traditional monitoring — looking at samples or a single body of code — just won’t cut it. To understand request flows within a web of microservices, you must collect additional data, such as:
- The specific service instance or version that handles the request
- Where it is hosted within your distributed environment
Because traces are distributed across different services, this process of tagging spans and correlating them is called “distributed tracing”.
How distributed tracing works
Imagine a popular online video game with millions of users. This game must keep track of each player’s location, every interaction they have with each other, the items they pick up in the game and a variety of other data generated during play. Keeping the game running smoothly would be unthinkable with traditional tracing methods — distributed tracing makes it possible.
Distributed tracing follows a request (transaction) as it moves between multiple services within a microservices architecture, allowing so you can identify where the service request originates from (user-facing frontend application) throughout its journey with other services.
As an example of distributed tracing, imagine a collection of microservices in a standard modern application:
- The user interface is rendered by a small group of microservices.
- User data is recorded in a database (that runs as a different service).
- Some number of small backend services handle data processing.
In this environment, a distributed trace of the user’s request would start by recording information about the request’s status on the first frontend service — which data the user inputs and how long it takes the service to forward that data to other services.
The next touchpoint in the trace would involve the backend services, which accept the input and perform any necessary data processing, like ETL or, increasingly, ELT. Then, the backend services transfer the processed data to the database service, which stores it.
Example of distributed tracing
Let’s consider a simple client-server application:
- The client sends a request to the server for a specific customer.
- The server processes the request and sends the response back to the client.
Within the context of the client, a single action has occurred. The client sent a request and got a response — but we observe each server request generated as a result of this client request in a span. As the client performs different transactions with the server in the context of the application, more spans are generated. We can correlate them together within a trace context.
The trace context is the glue that holds the spans together. Take a look at this breakdown:
- Client sends a customer name request to Server at time: X (Trace Context: customerrequest1, SpanID: 1, timestamp: X)
- Server receives customer name request from Client at time: Y (Trace Context: customerrequest1, SpanID: 2, timestamp: Y)
- Server parses the request from the Client at time: Z (Trace Context: customerrequest1, SpanID: 3, timestamp: Z)
Note that the trace context remains the same, tying each span together and letting the infrastructure know that each span belongs to the same transaction.
A distributed tracing tool first correlates the data from all the spans and then formats them into visualizations that are available either:
- On request through a web interface
- Provided automatically through alerting or AIOps tools
Instrumentation: how to generate traces
To gather traces, your applications must first be instrumented. Instrumenting an application requires using a framework, like OpenTelemetry, in order to generate traces and measure application performance. This information is super helpful: now you easily locate bottlenecks — and quit spending time seeking them out.
As long as you’re using a vendor-agnostic framework, like OTel, you’ll only have to do instrumentation work once.
Collecting traces, exporting traces
Once your application has been instrumented, you’ll want to begin collecting this telemetry using a collector.
The Splunk OpenTelemetry collector is a great example. The collector provides a unified way to receive, process, and export application telemetry to an analysis tool like Splunk APM, where you can:
- Create dashboards, business workflows and identify critical metrics.
- Quickly correlate events like increases in latency or errors with tag values, providing a one-stop-shop to understand how traces are behaving across your entire application.
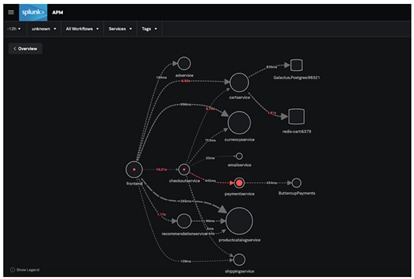
- Sift through trace data in seconds to immediately highlight which microservice is responsible for errors within the dynamic service map.
Can you guess which microservice is ultimately responsible for the errors in the application? With Splunk, you can go even deeper than this to determine which version of paymentService is responsible.
Outcomes & benefits of distributed tracing
The main benefit of distributed tracing is visibility into real user transactions in one place. Complexity doesn’t matter. Some benefits that come from a more holistic approach include:
Razor-sharp performance problem identification
By monitoring the request’s status and performance characteristics on all these services, SREs and IT teams can pinpoint the source of performance issues. You can track specific, minute detail to know the responsiveness of each individual service in order to determine, for example that:
- The database service is suffering from high latency.
- A service that renders part of your homepage is failing 10% of the time.
Increased productivity
The disjointed nature of microservice architectures makes application performance monitoring — including functions such as tracking down and fixing performance issues — time consuming and expensive compared to monolithic applications.
Additionally, the way failure data is delivered in microservices isn’t always clear and often requires developers to decipher issues from error messages and arcane status codes. Distributed tracing provides a more holistic view of distributed systems that:
- Reduces developer time spent diagnosing and debugging request failures and latencies.
- Makes troubleshooting root causes more efficient
All this ultimately improves your mean time to recovery/repair (MTTR).
Improved collaboration among teams
In a microservice environment, each process is generally the responsibility of a particular team. This can cause problems when it becomes necessary to identify errors and determine who is responsible for fixing them. In this context, distributed tracing helps to:
- Identify which team is responsible for fixing which issues.
- Accelerate response time.
- Enable teams to work together more effectively.
Flexible implementation
Distributed tracing tools work with a wide variety of applications and programming languages, so developers can incorporate them into virtually any system and view data through one tracing application.
Types of tracing
Code tracing
Code tracing refers to a programmer’s interpretation of the results of each line of code in an application and recording its effect by hand instead of a debugger — which automates the process — to trace a program’s execution.
Manually tracing small blocks of code can be more efficient because the programmer doesn’t need to run the entire program to identify the effects of small edits.
Data tracing
Data tracing helps check the accuracy and data quality of critical data elements (CDEs) trace them back to their source systems, and monitor and manage them using statistical methods. Typically, the best way to perform accuracy checks is to trace operations to their origins and validate them with source data — although historically this hasn’t been cost-effective in large operational processes.
Program trace (ptrace)
A program or stack trace is an index of the instructions executed and data referenced during the running of an application. The information displayed in a program trace — the program name, language, and the source statement that was executed, among other data — is used in the debugging process.
Tracing projects & tools
Open distributed tracing standards: OpenTelemetry
With applications consisting of different coding languages, distributed microservices, and written by people all over the globe, it helps to have an open vendor agnostic framework you can use to instrument your applications.
For many languages, OpenTelemetry provides automatic instrumentation of your application, where others must be manually instrumented.
Jaeger & Zipkin
Jaeger and Zipkin are two popular open-source request tracing tools, each with similar components: a collector, datastore, query API, and web user interface.
Both work like this: Outgoing requests are traced along with the application. The collector then records and correlates the data between different traces and sends it to a database where users can query and analyze it via the UI.
Jaegar and Zipkin are differentiated by their architecture and programming language support — Jaeger is implemented in Go, Zipkin in Java. Zipkin supports virtually every programming language with dedicated libraries for Java, Javascript, C, C++, C#, Python, Go, Scala, and others. Jaeger’s supported-language list is shorter: C#, Java, Node.js, Python, and Go.
Apache Kafka
Kafka is a distributed event streaming platform, providing a high-throughput, low-latency platform for handling real-time data feeds, often used in microservice architectures. It’s used to:
- Process streams of records in real time.
- Publish and subscribe (pub/sub) to those record streams in a manner similar to a message queue.
- Store them in a “fault-tolerant durable way.”
Kafka uses “topics” — a category or feed name to which records are published — to abstract streams of records. For each topic, Kafka maintains a partitioned log, an ordered, continually appended sequence of records that can serve as an external commit log for a distributed system.
Distributed tracing is essential today
Using microservices for cloud-based apps is the norm today. Distributed request tracing offers a huge advantage over the older, needle-in-a-haystack approach to tracking down the problems that could disrupt your services.
If you’re responsible for a microservice-based system, equipping your enterprise with this powerful technology will optimize how you do your job. Try distributed tracing with Splunk Observability. Try it for free to get a real-time view of your tracing telemetry and start solving problems faster.
What is Splunk?
This posting does not necessarily represent Splunk's position, strategies or opinion.