 By Shanika Wickramasinghe October 27, 2023
In in order to achieve DevOps success, you must measure how well your DevOps initiatives work. Tracking the right DevOps metrics will help you evaluate the effectiveness of your DevOps practices.
In this article, I’ll explain many DevOps metrics, including their significance, the key metrics for various goals, and — best of all — tips for improving the score of each DevOps metric discussed here.
(For the latest on DevOps, explore the state of DevOps today and these DevOps conferences & events.)

DevOps metrics: do you need them?
DevOps metrics are the data that aid in measuring the performance of key DevOps practices or processes such as:
- Continuous Integration (CI)
- Continuous Deployment
- Automated Testing
- Continuous Monitoring
These metrics enable organizations to monitor their progress — are you achieving the goals that you’ve set out? Metrics also help identify any bottlenecks that prevent you from maximizing application performance and employee productivity from DevOps processes. Utilizing these metrics will allow you to make the necessary improvements and get the maximum return on your investments.
In this article, we’ve broken down these metrics into a few categories:
- DORA’s four key metrics
- Optimizing tests and code quality
- Optimizing deployment
- Optimizing continuous integration
- Measuring customer satisfaction
- Optimizing monitoring practices
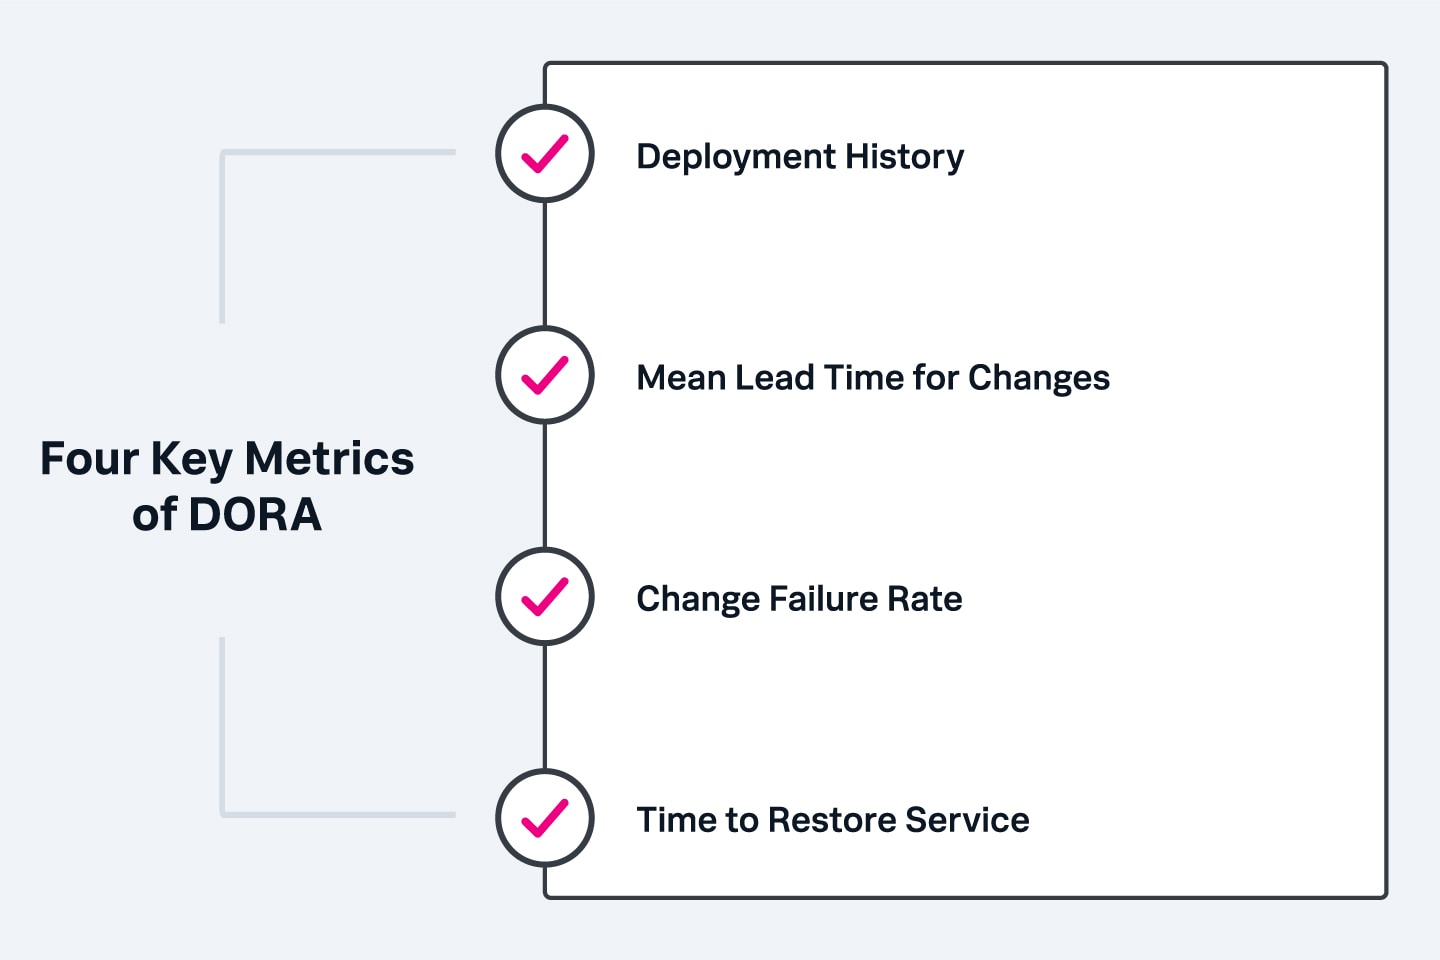
DORA DevOps Metrics
A well-known set of DevOps metrics are from DORA, Google's DevOps Research and Assessment (DORA) team. Over the years, DORA has identified what distinguishes high-performing DevOps teams. These four metrics are defined thanks to 7+ years of research on DevOps principles and their practical applications.
The DORA framework uses the four key metrics outlined below to measure two core areas of DevOps: speed and stability. Deployment Frequency and Mean Lead Time for Changes measure DevOps speed, and Change Failure Rate and Time to Restore Service measure DevOps stability. Used together, these four DORA metrics provide a baseline of a DevOps team’s performance and clues about where it can be improved.
The following section briefly explains these four key DevOps Metrics, what a good score is and how to improve them.
Change failure rate (CFR)
Change failure rate is the percentage of deployments causing a failure in production that require an immediate fix, such as service degradation or an outage. A low change failure rate is desirable because the more time a team spends addressing failures, the less time it has to deliver new features and customer value. This metric is usually calculated by counting how many times a deployment results in failure and dividing that by the total number of deployments to get an average. It does not count the bug fixes before deploying to production. You can calculate CFR by counting the number of deployments and, out of them, how many have resulted in hotfixes or rollbacks. You can calculate this metric as follows:
(deployment failures / total deployments) x 100
Change failure rate benchmarks are:
- Elite: 0-15%
- High: 16-30%
- Medium: 16-30%
- Low: 16-30%
This metric is a good indicator of:
- Your code quality
- The effectiveness of your testing methods
The CFR of your team should sit between 0-15% if you are following effective DevOps practices. Practices like trunk-based deployment, test automation and working in small increments can help improve this metric.
Deployment frequency (DF)
DF is a measure of how frequently you deploy changes to production. High-performing teams usually deploy code to production on-demand or multiple times a day. Deploying monthly or weekly will result in a lower DF.
This metric helps teams to:
- Respond to changing customer requirements.
- Fix bugs faster.
- Introduce enhancements to existing features.
- Reduce the risks associated with less frequent or larger deployments.
The deployment frequency benchmarks are:
- Elite: Multiple deployments per day
- High: One deployment per week to one per month
- Medium: One deployment per month to one every six months
- Low: Fewer than one deployment every six months
Organizations vary in how they define a successful deployment, and deployment frequency can even differ across teams within a single organization.
(Read our full guide to deployment frequency.)
Lead time to changes (LT)
Lead time is the time a code commit requires to become production-ready after passing all the necessary tests in the pre-production environment. Calculate this metric using the times of the code commit and the start of the release.
Mature DevOps teams maintain LT in hours, while medium or low-performing teams usually take days or weeks. You can improve the LT by implementing practices like trunk-based deployment, working in small batches and test automation.
Mean lead time for changes benchmarks are:
- Elite: Less than one per hour
- High: Between one day and one week
- Medium: Between one month and six months
- Low: More than six months
An organization’s particular cultural processes — such as separate test teams or shared test environments — can impact lead time and slow a team’s performance.
Mean time to restore service (MTTR)
MTTR is the time it takes to recover from a total failure or partial service interruption in a production environment. High-performing teams maintain an MTTR of less than one hour, while it can be as high as a week for low-performing teams. You can calculate MTTR by considering the time an incident occurred and the time it took to resolve it.
The MTTR score depends on how quickly you can identify an incident when it occurs and deploy a fix for it. You can improve the MTTR score by continuously monitoring systems and services and alerting the relevant personnel as soon as an incident occurs. It allows them to take the necessary actions quickly.
Time to Restore Service benchmarks are:
- Elite: Less than one hour
- High: Less than one day
- Medium: Between one day and one week
- Low: More than six months
Applications & Use Cases for DORA Metrics
Companies in virtually any industry can use DORA metrics to measure and improve their software development and delivery performance. A mobile game developer, for example, could use DORA metrics to understand and optimize their response when a game goes offline, minimizing customer dissatisfaction and preserving revenue. A finance company might communicate the positive business impact of DevOps to business stakeholders by translating DORA metrics into dollars saved through increased productivity or decreased downtime.
Benefits and Challenges of DORA metrics
DORA metrics are a useful tool for quantifying your organization’s software delivery performance and how it compares to that of other companies in your industry. This can lead to:
- Better decision making: Consistently tracking DORA metrics helps organizations use hard data to understand the current state of their development process and make decisions about how to improve it. Because DORA helps DevOps teams focus on specific metrics rather than monitoring everything, teams can more easily identify where bottlenecks exist in their process, focus efforts on resolving them and validate the results. The net result is faster, high-quality delivery driven by data rather than gut instinct.
- Greater value: Elite and high performing teams can be confident they are delivering value to their customers and positively impacting the business. DORA metrics also give lower-performing teams a clear view of where their process may be stalled and help them identify a path for delivering greater value.
- Continuous improvement: DevOps teams can baseline their performance with DORA metrics and discover what habits, policies, processes, technologies and other factors are impeding their productivity. The four key metrics provide a path to setting goals to optimize the team’s performance and determine the most effective ways to do so.
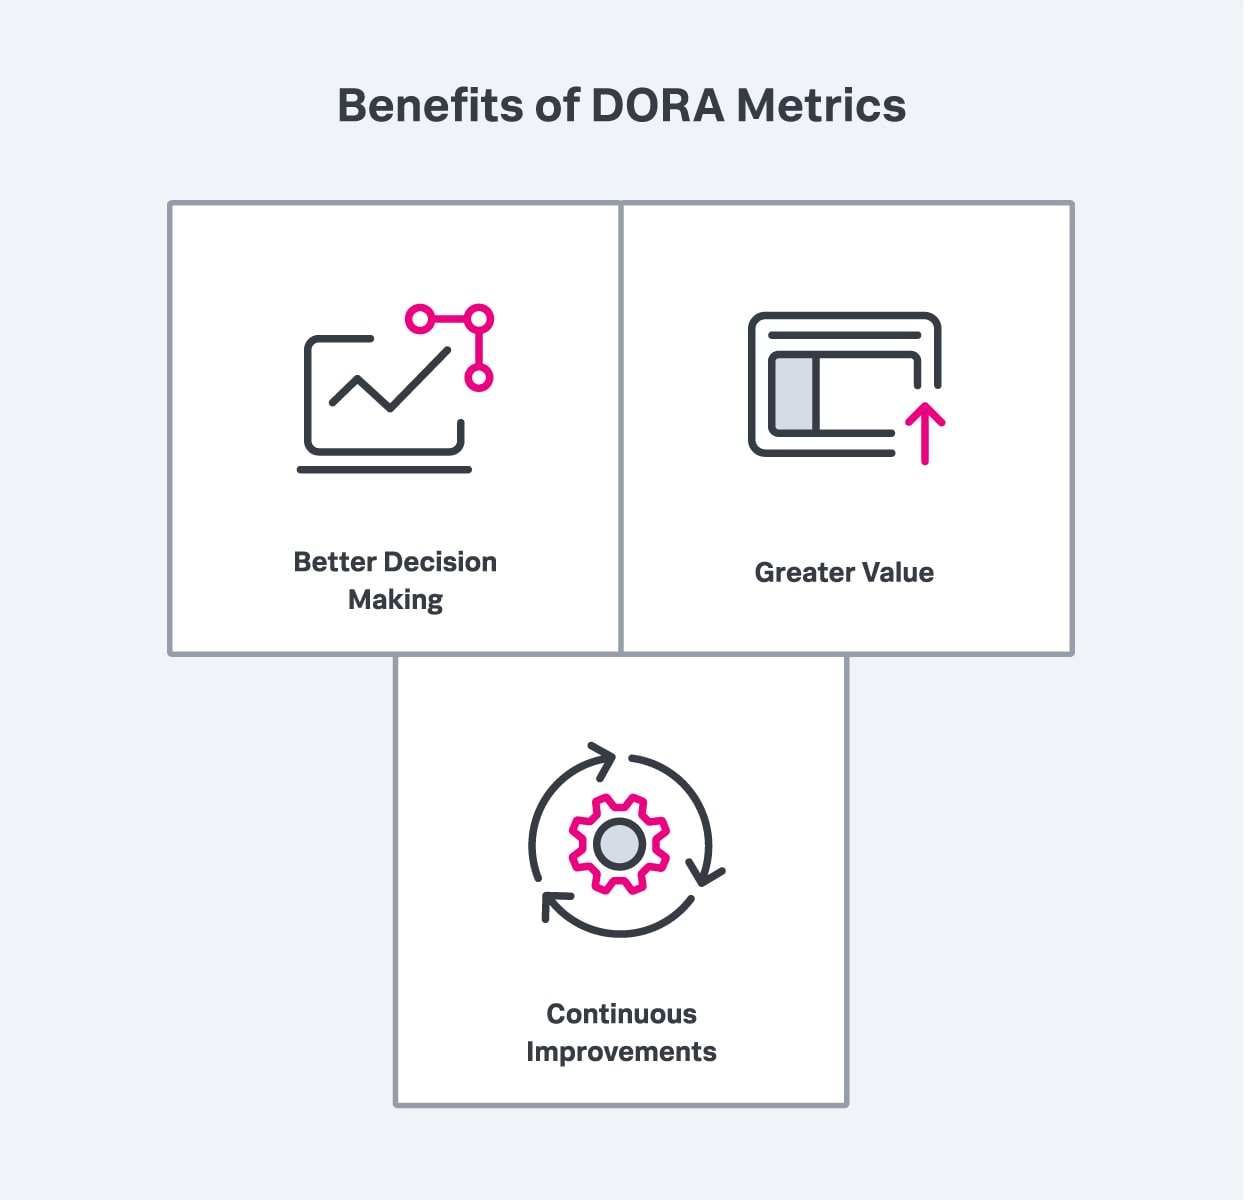
DORA metrics can lead to better decision making, greater value and continuous improvement.
Even though DORA metrics provide a starting point for evaluating your software delivery performance, they can also present some challenges. Metrics can vary widely between organizations, which can cause difficulties when accurately assessing the performance of the organization as a whole and comparing your organization’s performance against another’s.
Each metric typically also relies on collecting information from multiple tools and applications. Determining your Time to Restore Service, for example, may require collecting data from PagerDuty, GitHub and Jira. Variations in tools used from team to team can further complicate collecting and consolidating this data.
DevOps metrics for different goals
OK so DORA’s metrics give us a great place to start. Still, several more important DevOps metrics help measure the success of DevOps processes. Let's go through them in the following sections. We’ve broken these sections into metrics for tests and code quality, deployment, continuous integration, customer satisfaction and, lastly, monitoring practices.
Metrics for optimizing tests & code quality
Defect escape rate
This metric measures the number of defects that escaped from lower-level testing and were pushed into production. Your teams should maintain this value close to zero. A higher Defect Escape Rate indicates that your testing processes need more automation and improvement.
DevOps teams should find at least 90% of the defects in pre-production environments before releasing the code to production.
CI test failure rate
This metric is a good indication of your code quality. You can measure it by dividing the number of tests that failed in the CI pipeline by the total number of tests executed.
A high CI test failure rate indicates your code needs more improvement and persuades developers to execute their own unit tests before committing the code.
Code Coverage
Code coverage indicates the amount of code tested by the automated test suite. Generally, the best DevOps practice is to maintain a higher automated code coverage as it helps detect failures quickly. However, having 100% test coverage does not ensure maximum code quality, as it can include unnecessary testing.
Metrics for optimizing deployment & workflows
Cycle time
Cycle time measures the time between the start of working on a specific item and when it becomes ready for end-users. In terms of development teams, cycle time is the time between a code commit and when it is deployed to production.
The longer the Cycle Time, the more work in progress — and the less efficient the workflows are. Teams need to optimize and improve the efficiency of their workflows to improve the Cycle Time.
Deployment size
Deployment size is determined by the number of implemented features, stories and bug fixes. You can measure it using the number of story points completed for each deployment. Combine this metric with other metrics like deployment frequency and cycle time to understand the productivity of each deployment.
Deployment time
Deployment time is the time it takes to complete a deployment. It is a useful DevOps metric to measure the efficiency of your deployment pipelines. If the deployment time is very long, taking many hours to deploy, it indicates a potential problem and decreases the productivity of your release team.
You can improve this metric by removing unnecessary steps from the deployment pipeline and introducing parallelization mechanisms.
Flow metrics
Flow metrics are a framework for measuring how much value is being delivered by a product value stream and the rate at which it is delivered from start to finish. While traditional performance metrics focus on specific processes and tasks, flow metrics measure the end-to-end flow of business and its results. This helps organizations see where obstructions exist in the value stream that are preventing desired outcomes.
There are four primary flow metrics for measuring value streams:
- Flow velocity measures the number of flow items completed over a period to determine if value is accelerating.
- Flow time measures how much time has elapsed between the start and finish of a flow item to gauge time to market.
- Flow efficiency measures the ratio of active time to total flow time to identify waste in the value stream.
- Flow load measures the number of flow items in a value stream to identify over- and under-utilization of value streams.
Flow metrics help organizations see what flows across their entire software delivery process from both a customer and business perspective, regardless of what software delivery methodologies it uses. This provides a clearer view of how their software delivery impacts business results.
Metrics for optimizing continuous integration (CI)
CI runs per day
This metric is a count of daily CI pipeline executions. High-performing teams maintain more CI runs per day, typically 4 or 5 times per developer. It indicates the proper practice of frequent releases and trusts in the CI/CD pipeline.
CI success rate
CI can take place many times a day, even though each of them may not be successful. The CI success rate is measured by dividing the total number of successful CIs by the total number of CI runs. It’s better to have a higher CI success rate: it indicates that your CI/CD processes are well maintained and developers perform dev testing effectively.
Metrics to measure customer satisfaction
Of course, the goal of all of this is to satisfy your customers. Here’s what to measure.
Customer ticket volume
The number of reported incidents or support tickets filed by customers indicates how satisfied your customers are with your products. This metric also helps track customer feedback on your releases and provides visibility into the severity of production issues.
Lower customer ticket volumes indicate you have the right approaches and only need slight improvements.
Application availability/uptime
Application availability is the time the application is available to the end-users in its fully functional state. Application errors can cause longer downtimes, causing frustration among users who try to access your application. To improve application availability, teams must lay out strategies like:
- Highly available cloud infrastructure
- Auto-scaling
- Disaster recovery plans (backup and restore)
- Tight security mechanisms
Application performance
This metric evaluates how the application performs under stress and various user loads. Teams must carry out these tests before deploying to production in a pre-deployment environment equivalent to production.
This metric enables them to identify transactions that can fail and defects when the system is under load. Then, they can optimize the code before deploying and provide a consistent user experience.
Metrics for optimizing monitoring practices
Mean time to detection (MTTD)
MTTD is the time it takes to detect a production failure and flag it as an issue. This metric helps evaluate the effectiveness of your monitoring and alerting systems. The lower the MTTD, the more likely it is that you can fix the issue and push it into production before it affects end users. You can improve MTTD by:
- Employing robust monitoring tools.
- Maintaining good application monitoring coverage.
(Read all about DevOps monitoring and see how Splunk can help.)
Application usage and traffic
This metric indicates how many users are accessing their systems and how many transactions are happening in real-time. There is a high risk of systems failing when there is a high load. Therefore, you can keep your DevOps team on standby to respond in case of any issues.
Tools for Tracking DevOps & DORA Metrics
Once you automate DevOps metrics tracking, you can begin improving your software delivery performance. Several engineering metrics trackers capture common DevOps metrics, including:
When considering a metric tracker, it’s important to make sure it integrates with key software delivery systems including CI/CD, issue tracking and monitoring tools. It should also display metrics clearly in easily digestible formats so teams can quickly extract insights, identify trends and draw conclusions from the data.
DevOps metrics for a variety of practices
DevOps metrics are data that enable organizations to assess the effectiveness of their DevOps practices and how they contribute to the achievement of organizational goals. The four key DevOps Metrics include Change Failure Rate, Deployment Frequency, Lead Time To Change, and Mean Time To Restore Services.
Additionally, several other DevOps metrics have been identified related to key tasks of a software delivery pipeline, including deployment, testing, monitoring and end-user experiences. These metrics can ensure successful business outcomes by measuring them with the DevOps processes organizations have implemented.
What is Splunk?
This posting does not necessarily represent Splunk's position, strategies or opinion.