 By Stephen Watts October 09, 2023
Database monitoring, or database performance monitoring, is the practice of monitoring databases in real time. By tracking specific metrics, database monitoring enables teams to understand the health and behavior of their database systems. This in turn helps with troubleshooting and finding ways to optimize database performance.
Using Splunk for Database Query Performance Monitoring
Slow database queries might be the culprit of wider service availability issues. With Database Query Performance, you can monitor the impact of your database queries on service availability directly in Splunk APM. This way, you can quickly identify long-running, unoptimized, or heavy queries and mitigate issues they might be causing, without having to instrument your databases.
- Learn about Splunk Application Performance Monitoring (APM)
- Learn about using Splunk APM for databases, including MySQL, Db2, Redis, Oracle, Microsoft SQL Server, and more
- Take a free Guided Tour of Splunk APM to see how it works
In addition to APM, Splunk DB Connect and other Splunkbase Apps connect a variety of databases to Splunk Enterprise and Splunk Cloud Platform. See the video below for more information on this capability.
Since databases power every organization’s business-critical apps and services, database monitoring is a vital part of database management. Database performance issues such as slow queries or too many open connections can slow down these apps and services or make them temporarily unavailable — affecting end user experience. Database monitoring gives teams insight into software health and also the health of database server hardware so they can identify and fix performance problems before they impact users. The insights gleaned from database monitoring can also inform developers how to make improvements to their application infrastructure and guarantee high performance.
In the following sections, we’ll look at how database monitoring works and outline the most important database metrics to monitor to optimize performance. We’ll also cover what kind of database monitoring tools are available and how to choose the best one for your organization.

The Importance of Database Monitoring
Database monitoring is important because databases are an integral part of modern IT infrastructure. Database issues can slow application and service response times and otherwise hamper their performance. Effective database monitoring helps you identify and quickly resolve performance issues so you can maintain database server availability and ensure databases continuously provide organizations with the services and applications that drive their daily business.
Improving & Maintaining Database Performance
Database performance describes the rate at which a database supplies information to the users requesting it. A database that meets this demand at a high rate is considered to be performing well. If it causes bottlenecks in a business process or an application, it is deemed to be performing poorly.
Many factors influence database performance, but five are particularly impactful. These include:
- Workload: Workload refers to the total volume of requests made by users and applications of a database. It can include various types of queries, batch jobs, online transactions, system commands and all other demands placed on the system at a given time. Workloads fluctuate dramatically over time, even from one second to the next. Occasionally, you can predict workload — for example, a heavier demand during seasonal shopping or end-of-month payroll processing and lighter demand after business hours — but most of the time workload is unpredictable.
- Throughput: Throughput describes the volume of work done by the database over time, typically measured as the number of queries executed per second, minute or hour. If a database’s throughput is lower than the number of incoming queries, it can overload the server and result in increased query response times, which in turn slow down a website or application. Throughput issues can indicate a need to optimize queries or upgrade the server.
- Resources: Resources are hardware and software tools used by the database. These include CPU, memory, cache controllers and microcode. The resources at the disposal of the database dramatically impact all the other database performance factors.
- Optimization: Optimization refers to the strategies used to increase the speed and efficiency with which information is retrieved from the database. Optimization practices include deleting unused tables, ensuring proper indexing, using appropriate data types and other database tuning techniques. Optimization is an ongoing process that requires continuous monitoring, analysis and improvement.
- Contention: Contention occurs when two or more workload processes are trying to access the same data at the same time. In a SQL database, for example, contention results when multiple transactions try to update the same row simultaneously. If one transaction attempts to act on data that’s in the process of being changed by another, the database has to prohibit access to, or “lock,” the data until the change is complete to ensure the accuracy and consistency of that data. As contention increases, as is likely during periods of high demand, throughput decreases.
Ultimately, database administrators orchestrate these factors to ensure optimal database performance — optimizing resources to maximize throughput and minimize contention so that the database can efficiently process the largest possible workload.
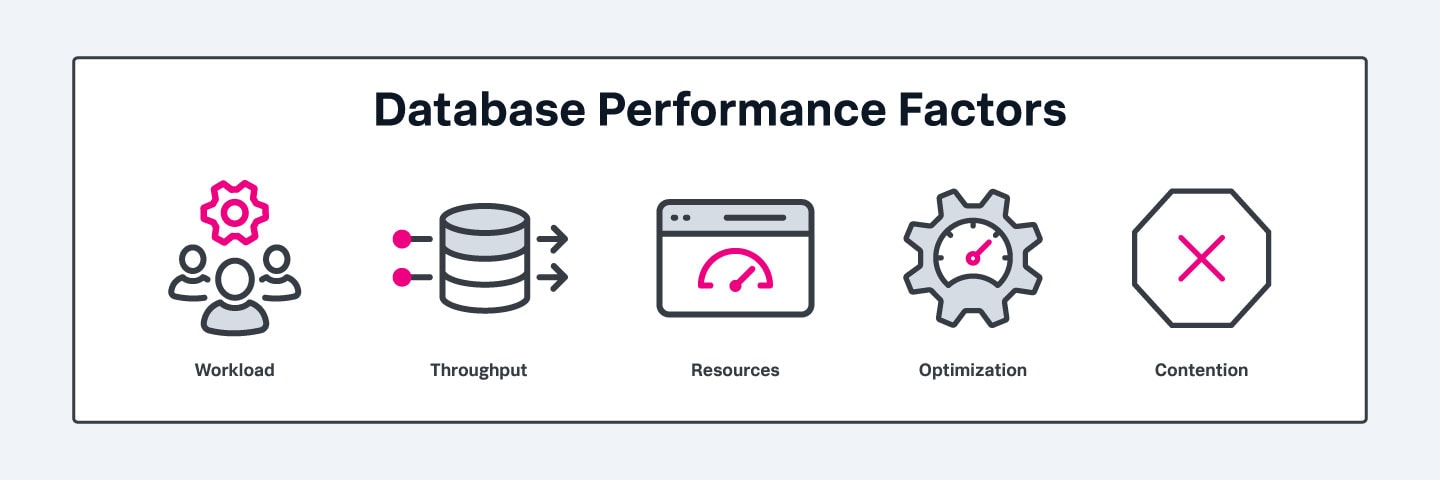
These five factors are especially important for database performance.
Common Examples & Use Cases for Database Monitoring
Some examples of database monitoring include tracking:
- Query response time
- Database throughput
- Errors
- Open connections
These factors have a significant impact on the health of a database and how well it performs. Database monitoring also tracks whether a database is online and its resource consumption, both of which strongly impact the availability of the apps and services it supports.
Benefits of Database Monitoring
Database monitoring offers organizations several benefits by helping identify problems such as:
- Performance issues: Database monitoring helps database administrators identify slow and resource-intensive queries that bog down performance. They can use this information to tune particular queries or modify application logic to boost the database’s overall response time.
- Resource shortages: Database monitoring tools can help you understand when you’re at risk of exceeding resource thresholds, enabling you to proactively address them. Common issues such as memory shortages and overworked CPUs can be resolved before they compromise performance or availability.
- User access anomalies: Database monitoring can support security efforts by alerting database teams to uncharacteristic or suspicious user access patterns. These may signal malicious behavior by internal or external actors to compromise sensitive data. An uptick in failed logins, for example, could indicate a potential brute-force cyber attack and would warrant investigation.
Challenges with Database Monitoring
The main challenge of database monitoring is determining what to monitor. While it’s tempting to monitor everything, this will overwhelm teams and make it difficult to know where to focus their optimization efforts. A good starting point is to start with monitoring the basic metrics outlined above along with any others that have a customer-facing impact.
Database Monitoring Metrics & KPIs
As with other components of IT infrastructure, many metrics help indicate the health and performance of a database. Tracking all of them, though, would overwhelm IT administrators. Fortunately, you can get a good understanding of your database’s behavior by monitoring the basics. These include:
- Response time: A critical metric for any database, response time measures the average response time per query for your database server. Database monitoring solutions usually represent this as a single number — 5.4 milliseconds, for example. Most tools will also let you measure the average response time for all queries on your database server or database instance, break the response time down by query type (select, insert, delete, update), and display these in graph form. Monitoring response time is important because it allows developers to identify how long sessions are waiting for database resources and helps them make better performance decisions to be proactive and discover root causes of performance issues.
- Database throughput: As mentioned, throughput denotes the volume of work performed by your database server over a unit of time. It’s commonly measured as the number of queries executed per second. Monitoring throughput allows you to understand how quickly your server is processing incoming queries. Low throughput can overload your server and increase the response time for each query, ultimately bogging down your application or website. As with response time, most database monitoring solutions will allow you to monitor throughput for each of the most commonly used types of queries.
- Open connections: Database connections enable communication between client software and the database, allowing applications to send queries, access database data sources, and receive responses. When a database server goes down, it’s often the result of too many open connections, which can overload and slow down the database server. Monitoring the number of open connections allows you to address the issue of too many connections before it compromises database performance.
- Errors: Databases return an error each time a query doesn’t run successfully. Errors can cause a website or app to become inaccessible, which, depending on the affected service, can result in lost revenue, reduced productivity, or other negative business impacts. Monitoring errors can help you more quickly fix them and increase database availability. Database monitoring solutions allow you to track the number of queries for each error code so that you can see the most frequently occurring errors and determine how to resolve them.
- Most frequent queries: Tracking the top 10 queries your database server receives along with their frequency and latency will enable you to optimize them for an easy performance boost.
There are many other database performance metrics, and there’s no one-size-fits-all approach to monitoring metrics. But the metrics listed here will provide any organization with a strong foundation to build upon.
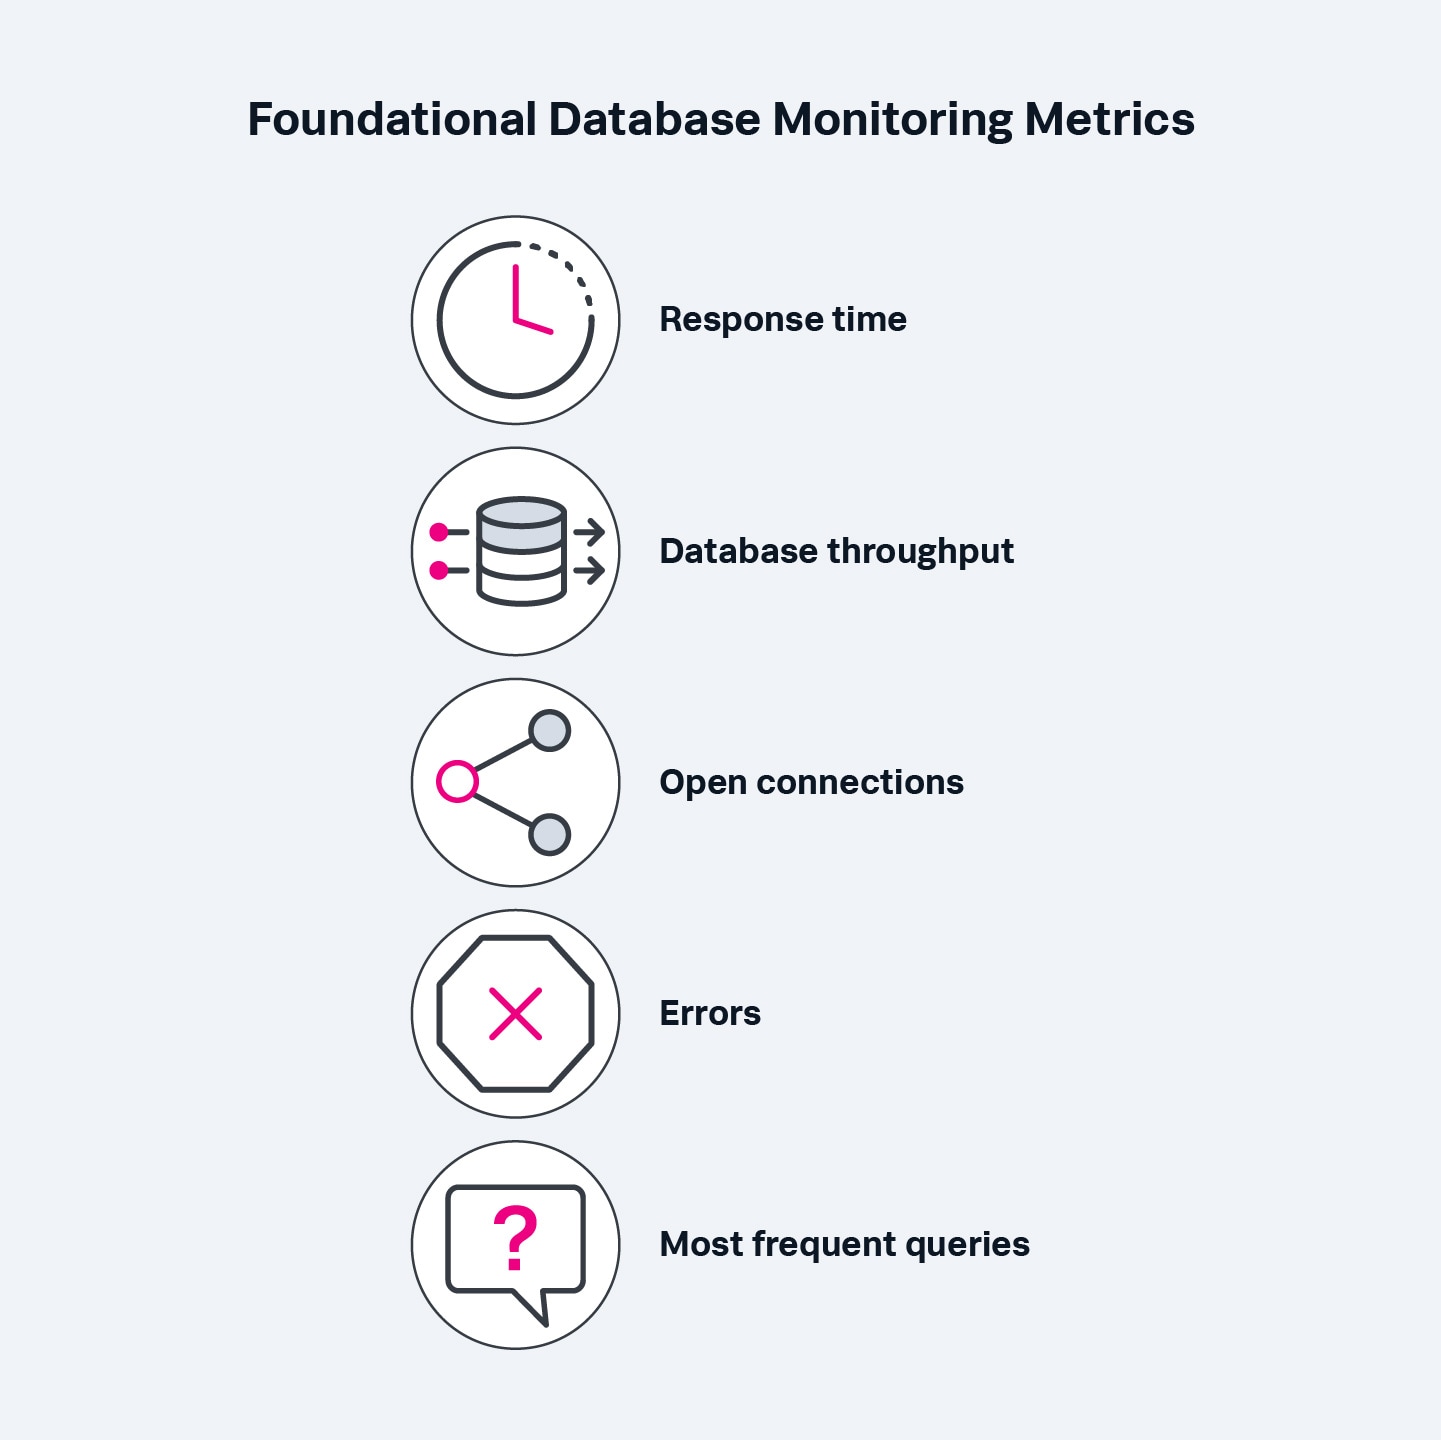
These are some of the foundational metrics you can start with to launch your database performance monitoring practice.
Database Monitoring Implementations
Monitoring can be implemented throughout your system architecture and is customizable to suit your organizational needs. The most common implementations include:
- Resource monitoring: Also referred to as server monitoring or infrastructure monitoring, this approach tracks system performance from your servers and other IT-related resources connected to your network. Resource monitoring solutions gather and report data on CPU load, RAM usage, remaining disk space, and other critical server metrics.
- Network monitoring: Network monitoring tracks the data going in and out of your network. Network monitoring tools gather all incoming requests and outgoing responses across all of the computer network's connected components such as routers, switches, firewalls, servers, and more. These solutions are analyzers that enable you to see the total volume of incoming and outgoing data as well as drill down to the frequency of specific requests.
- Application performance monitoring: Application performance monitoring (APM) allows you to gauge your applications’ performance on users’ devices, providing you with critical information around app availability. APM solutions collect data on how an overall service is performing, such as error rates, CPU usage, response times, and more. These tools work by sending requests to the service and tracking the speed and completeness of the response. APM enables you to detect and diagnose application performance issues before they impact users, ensuring app services achieve expected performance levels.
- Third-party component monitoring: This approach monitors the health and availability of any third-party components in your architecture. This is particularly important in microservice-based architectures as their services rely on the proper functioning of cloud hosts, ad servers, and other external services. As with APM solutions, third-party component monitoring tools can send their own requests to third-party services to check their performance status.
Another consideration is whether to choose open-source or commercial monitoring software or tools. Open-source monitoring tools are advantageous for organizations concerned with pricing, and they also offer complete customization, making them easier to integrate into your existing architecture. The drawback of open-source monitoring tools is that they often require specialized skills and knowledge to implement and maintain, demanding more dedicated development time. Commercial tools, while costly, come with more robust features and support. In addition to managing their solution, providers will offer ample training and customer service and generally help you integrate their tool with your existing stack.
Database Monitoring Best Practices
You can maximize your database monitoring efforts by following a few best practices, including:.
- Monitor availability and resource consumption: The most basic monitoring practice is to regularly check that databases are online, during both business and non-business hours. Most monitoring tools will do this automatically and alert teams to an outage. Monitoring resource consumption including CPU, memory, disk, and network is also important, so you can be alerted to any issues before they compromise performance.
- Monitor slow queries: Improving slow queries is one of the easiest ways to boost application performance. Tracking the time needed for a query to complete, as well as measuring the resource usage for queries, will provide the necessary insights into database query performance. Start with the most popular queries, as they will have the biggest impact on database performance.
- Measure throughput: As mentioned, throughput refers to the volume of work the database is doing under normal conditions. Establish a baseline by taking readings at intervals over several weeks. These baseline measurements can then be used to set alert thresholds so teams can be notified when there’s an unexpected variation from normal values, prompting them to investigate.
- Monitor logs: Database logs contain a wealth of information, so it’s important to collect all of them, including slow query logs, scheduled task logs and routine maintenance logs. Log information will help you identify and resolve the cause of errors and failure, identify performance trends, predict potential issues, and even uncover malicious activity. Manually parsing the volume of log data produced by database systems isn’t possible, but a good database monitoring tool will be able to present relevant data in dashboard visualizations so teams can easily understand and act on insights.
Getting Started With Database Monitoring
To get started with database monitoring, you’ll need a monitoring tool. The breadth of available options — from tools that address one type of system component to all-in-one solutions — can be overwhelming and complicate your purchasing decision. To help hone in on your needs and narrow down the options, consider the following questions:
- What components — network, server, application — do you need to monitor?
- What kind of data do you need to collect and correlate?
- Do you only want to observe patterns over time or also be alerted to critical problems?
- What level of support does your organization need?
- What is your budget for monitoring?
- Will you be monitoring an on-premises (e.g., MySQL, MariaDB, PostgreSQL or a Microsoft SQL Server) or cloud environment (such as Microsoft Azure, Amazon RDS, Google Cloud, AWS, Amazon Aurora or Oracle Cloud) — or both?
The Bottom Line: Database monitoring is essential for ensuring app availability
Databases are the backbone of modern organizations. Deteriorating performance can slow your applications and services and ultimately have negative consequences for your business. Database monitoring provides the visibility you need to ensure availability, optimize performance, and ensure the best experience for your users.
What is Splunk?
This posting does not necessarily represent Splunk's position, strategies or opinion.