 By Muhammad Raza October 03, 2023
Anomaly detection is the practice of identifying data points and patterns that may deviate significantly from an established hypothesis.
As a concept, anomaly detection has been around forever. Today, detecting anomalies today is a critical practice. That’s because anomalies can indicate important information, such as:
- A pending or in-progress security breach
- A hardware or software problem
- Shifting customer demands
- Any number of challenges that require (immediate) attention
Let’s talk a look at the wide world of anomaly detection. It’s not only about how it works — that’s fairly straightforward — it’s really about knowing all the limitations that can come from not having the right type or quality of data. And we’ll end with a look at anomaly detection in AI, as interest in anomalies always grows with advances in AI, like those we’re seeing with generative and adaptive AIs.
How anomaly detection works
Detecting anomalies can be useful in all sorts of pursuits. In the business world, anomaly detection is commonly used to identify unusual incidents in the domain of cybersecurity and enterprise IT. Using AI models that describe the behavior of a system alongside data analytics, you can compare real-world data against the predicted values — and learn a lot of valuable information.
When the difference between the predicted and true data measurements exceeds a given threshold, the true data is identified as an outlier or anomaly. This information provides a direction for data analysts and decision makers to both…
- Investigate underlying causes for this outlier.
- Predict future trends.
There is rarely a universal basis or model that can fully represent the behavior of a complex real-world system.

For example, the network traffic flows to your servers are governed by a variety of factors and constraints. These include the performance of hardware and software systems that route traffic across the globe, the diverse user base you serve and their preferences and intent.
Despite inherent limitations, data-driven organizations nevertheless rely on concrete information from real-world interactions between technologies and end-users, often captured via monitoring options like synthetic monitoring and real-user monitoring. Using this information, they develop a data model or establish a generally acceptable basis that conforms to the applicable factors and constraints.
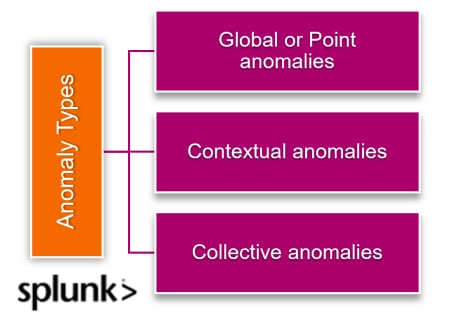
Types of anomalies
When looking at a time series of data (data that is collected sequentially, over a period of time), there are three main types of anomalies, which we’ll demonstrate with a classic example:
- Global anomalies (aka point anomalies): This anomaly is a piece of data that is simply much higher or lower than the average. If your average credit card bill is $2,000 and you receive one for $10,000, that’s a global anomaly.
- Contextual anomalies: These outliers depend on context. Your credit card bill probably fluctuates over time (due to holiday gift giving, for example). These spikes may look strange if you consider your spending in the aggregate, but in the context of the season, the anomaly is expected.
- Collective anomalies: These anomalies represent a collection of data points that individually don’t seem out of the ordinary but collectively represent an anomaly, one of which is only detectable when you look at a series over time. If your $2,000 credit card bill hits $3,000 one month, this may not be especially eyebrow-raising, but if it remains at the $3,000 level for three or four months in a row, an anomaly may become visible. These types of anomalies are often easiest to see in “rolling average” data that smooths a time series graph to more clearly show trends and patterns.
Indeed, anomaly detection plays a key role in financial activities, like financial crime risk management. But you can apply these anomaly types to any sort of data.
Detecting anomalies: Opportunities & challenges
This presents both a challenge and an opportunity to make informed decisions on data that appears as an outlier, a non-conformity to their existing models and hypothesis about the expected truth.
First things first: These anomalies may be introduced by a variety of reasons depending on the application. Considering the case of network traffic flows, above, a surge in user traffic could stem from a variety of places:
- A marketing video or social media moment that just went viral.
- A natural disaster that suddenly pushed the demand for your products in a particular geographical region.
- A malicious actor attacking your servers with a Denial of Service (DoS) attackadver.
- Other reasons as they occur.
Anomalies can emerge from a variety of sources, which are often naturally inadequately explained by your existing notion of truth.
In order to fully understand the underlying causes, the following key challenges are addressed as part of the anomaly detection process:
Defining a universal hypothesis is already a challenge
Defining a statistical model that encompasses all data dimensions (factors and the applicable constraints) and quantifying intangible qualitative metrics such as user preferences and intent is doubly challenging. Often, it is practically implausible or inviable.
Defining “anomaly” is not obvious
In the pursuit of defining a holistic model, any observation close to the edge of the normal and expected behavior can also be deemed as acceptable. Therefore, the boundary and limitations for anomaly detection may not be sufficiently inelastic for decision makers to differentiate between an outlier and normal behavior after all.
For example, if the anomaly results from an act of malicious intent, these adversaries could eventually adapt their actions or manipulate the system such that the anomalous observations conform to the acceptable models and hypothesis.
Add to it another complicating factor: The notion of anomaly deviates highly between the application and sensitivity of the situation. An unauthorized login attempt by a front-line employee of your ITSM organization may not be regarded as an anomaly. On the other hand, a similar attempt on a c-suite user account with escalated access privileges should be immediately alarming and trigger an automated control mechanism for intrusion prevention.
Normal or expected behavior is dynamic
The notion of normal and expected behavior within the organization itself evolves continuously. Internal organizational changes and a growing user base may require decision makers to redefine things like:
- What is normal (today or in the future?)
- What to expect
- What constitutes an anomaly
Big data changes our understanding of ‘truth’
In the age of big data, many organizations find themselves in a never-ending cycle of defining new metrics and factors that can affect their business decisions. An accurate unified model that accounts for all such class dimensions may not be developed due to several reasons.
- First, an accurate generalization will require a lot of information that is representative of all classes (both individually and collectively). In the real-world, data observations on every metric and factor may not be collected regularly and are frequently missing. If the model is not trained adequately on these metrics, the sporadic observations may be regarded as anomalous.
- Secondly, the models may not generalize adequately to real-world observations that tend to deviate significantly from normal, which is now dependent on a large number of metrics classes and KPIs.
Anomaly detection in artificial intelligence
And now, lastly, we turn to the big topic this year: working AI. Interest in anomaly detection renews whenever we leap forward in AI capabilities. In the domain of Artificial Intelligence, anomaly detection techniques study:
- The nature of data instances and observations, including incidents, sensor data, alerts and metrics data.
- The nature of deviation: contextual (related to multiple metrics or decision classes), point-wise (related to a single metric or decision category), behavioral (that cannot be assigned to specific quantitative metrics) and collective (which relates to all data instances from all metrics or decision classes).
- Learning methodology such as supervised (where the ground truth is available), unsupervised (where the ground truth is not available and the models find patterns within the datasets to make classifications) and semi-supervised (that incorporate some ground-truth).
- The output threshold, scores and classification labels for the deviation based on business context. The investigation aims to quantify the business impact of acting on the outcomes of an anomaly detection model.
An AI-based anomaly detection capability can be an important component of intrusion prevention systems that prevent unauthorized network traffic flows, login attempts and data transfers. They achieve this by…
- Evaluating the network request on a given set of metrics.
- Computing the expected behavior.
- Comparing the expected behavior with the true nature of the network request.
Given sufficient deviation, it is classified as unauthorized — and therefore prevents execution.
(Learn about the growing field of ethical AI.)
Anomaly detection: defining true behaviors
To summarize, anomaly detection is about defining normal behavior, developing a model that can generalize such a normal behavior and specifying the thresholds for observations that can be accurately deemed as a significant variation from the expected true normal behavior.
How your organization uses this information, however, is up to you. And THAT is where the good stuff happens.
What is Splunk?
This posting does not necessarily represent Splunk's position, strategies or opinion.